 Global
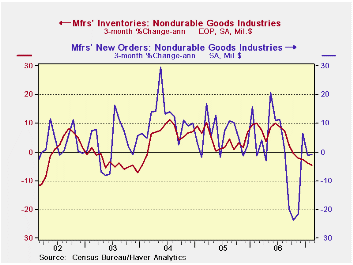 Each month the factory order report is a re-issue of durable goods from the week before with (usually) minor revisions plus a new look at nondurable goods shipments and inventories. This month the durable goods order gain was trimmed from a small rise of 2.5% to an even tinier rise of 1.7% for February following a plunge in January. The new data for February are for nondurable goods. Orders there rose by a meager 0.2% in the month. Over three months they are weak with shipments dropping by 1%. But the good news is that progress on inventory reduction is in train as inventories dropped by 4.4% in February.
The overall trends for the factory sector cut into three month blocks shows some revival in shipments compared to past trends. And there is a relatively sharp fall off in (still high) unfilled orders. Inventories are undergoing a gradual slowing in their build up. New orders continue to drop and at a slightly accelerated pace.
Each month the factory order report is a re-issue of durable goods from the week before with (usually) minor revisions plus a new look at nondurable goods shipments and inventories. This month the durable goods order gain was trimmed from a small rise of 2.5% to an even tinier rise of 1.7% for February following a plunge in January. The new data for February are for nondurable goods. Orders there rose by a meager 0.2% in the month. Over three months they are weak with shipments dropping by 1%. But the good news is that progress on inventory reduction is in train as inventories dropped by 4.4% in February.
The overall trends for the factory sector cut into three month blocks shows some revival in shipments compared to past trends. And there is a relatively sharp fall off in (still high) unfilled orders. Inventories are undergoing a gradual slowing in their build up. New orders continue to drop and at a slightly accelerated pace. Sector detail for nondurables shows a lot of weakness. Beverages are weak as are the Textile Mill and Product sectors. For Textiles inventory reduction is being achieved at a very rapid pace. Apparel has just turned positive and Leather Goods shows considerable strength. Paper Products and Printing are weak with shipments declining. Petroleum & Coal and Plastics & Rubber also are seeing shipment declines. Basic Chemicals and Pharmaceuticals & Medicines have turned sharply positive.
These are the readings that are new in the day’s report. They are hardly encouraging.
Factory Orders| Factory Orders | 3Mo | 6Mo | 9Mo | 12Mo | Year Ago | |
| Shipments | -3.5% | -9.4% | -5.6% | -1.0% | 6.6% | |
| New Orders | -9.0% | -7.8% | -4.9% | -0.8% | 7.1% | |
| Unfilled Orders | 14.5% | 23.6% | 20.3% | 20.8% | 17.0% | |
| Inventories | 1.0% | 2.8% | 5.0% | 6.4% | 2.5% | |
| Nondurable goods | 3Mo | 6Mo | 9Mo | 12Mo | Year Ago | |
| Shipments | -1.0% | -11.8% | -7.8% | -1.3% | 5.0% | |
| Inventories | -4.4% | -3.3% | 0.2% | 2.2% | 4.0% | |
| Nondurable Goods: Orders and Inventories by Industry | ||||||
| Food Products | 3Mo | 6Mo | 9Mo | 12Mo | Year Ago | |
| Shipments | 1.7% | 1.2% | 2.0% | 0.5% | 0.9% | |
| Inventories | -0.9% | 6.3% | 6.3% | 4.5% | 4.3% | |
| Beverages | 3Mo | 6Mo | 9Mo | 12Mo | Year Ago | |
| Shipments | -20.7% | -12.9% | -7.4% | 0.1% | 7.4% | |
| Inventories | 3.0% | 3.2% | 1.3% | -0.7% | 4.2% | |
| Textile Mills | 3Mo | 6Mo | 9Mo | 12Mo | Year Ago | |
| Shipments | -3.6% | -2.4% | -3.0% | -3.1% | -12.6% | |
| Inventories | -25.3% | -16.2% | -8.1% | -8.8% | -7.9% | |
| Textile Products | 3Mo | 6Mo | 9Mo | 12Mo | Year Ago | |
| Shipments | -4.1% | -8.6% | -11.9% | -8.5% | 3.9% | |
| Inventories | -11.6% | -9.2% | -1.3% | -2.6% | -0.6% | |
| Apparel | 3Mo | 6Mo | 9Mo | 12Mo | Year Ago | |
| Shipments | 0.8% | 3.7% | -8.6% | -1.9% | 8.0% | |
| Inventories | 7.4% | -22.6% | -12.4% | -9.2% | -1.1% | |
| Leather & Allied Products | 3Mo | 6Mo | 9Mo | 12Mo | Year Ago | |
| Shipments | 105.8% | 14.9% | 16.7% | 10.1% | -2.9% | |
| Inventories | 23.4% | 7.4% | 15.1% | 11.9% | -9.0% | |
| Paper Products | 3Mo | 6Mo | 9Mo | 12Mo | Year Ago | |
| Shipments | -2.6% | -5.5% | -5.3% | -1.5% | 1.1% | |
| Inventories | 5.8% | 2.9% | 0.4% | 1.9% | -1.9% | |
| Printing | 3Mo | 6Mo | 9Mo | 12Mo | Year Ago | |
| Shipments | -7.0% | 0.4% | 1.1% | 3.5% | -3.1% | |
| Inventories | -15.8% | -16.6% | -2.0% | 0.7% | -2.1% | |
| Petroleum&Coal | 3Mo | 6Mo | 9Mo | 12Mo | Year Ago | |
| Shipments | -1.3% | -32.7% | -23.7% | -5.3% | 17.2% | |
| Inventories | -15.5% | -30.4% | -19.2% | 4.5% | 16.3% | |
| Basic Chemicals | 3Mo | 6Mo | 9Mo | 12Mo | Year Ago | |
| Shipments | 4.7% | -10.3% | -5.9% | 0.2% | 4.0% | |
| Inventories | -0.4% | -1.0% | 1.7% | 1.9% | 2.9% | |
| Pharmaceuticals & Medicine | 3Mo | 6Mo | 9Mo | 12Mo | Year Ago | |
| Shipments | 19.6% | -6.5% | -6.8% | 6.3% | -1.0% | |
| Inventories | -7.4% | -1.1% | 5.5% | 11.0% | -4.6% | |
| Plastics & Rubber Products | 3Mo | 6Mo | 9Mo | 12Mo | Year Ago | |
| Shipments | -6.6% | -12.5% | -7.0% | -3.7% | 7.0% | |
| Inventories | 6.5% | 5.0% | 1.0% | 0.7% | 4.6% | |
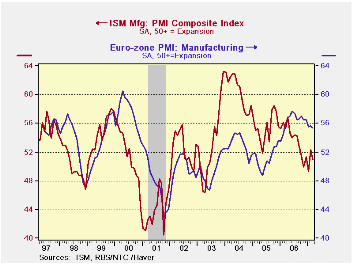
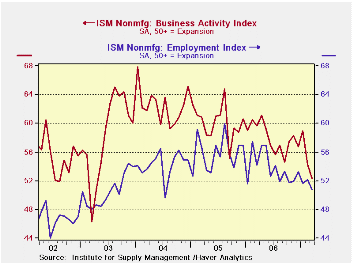 ISM trends show a weakening trend in the services-mining-construction sector of the economy to add to the lethargy in manufacturing.
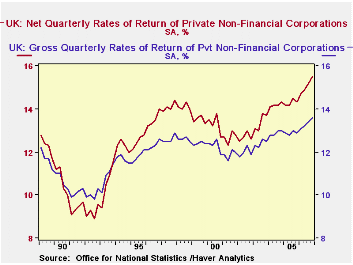 The net profitability of all private nonfinancial corporations in the United Kingdom was 15.5% in the fourth quarter of 2006. This rate was up from 15.2% in the third quarter and was the highest quarterly rate since the series began in the first quarter of 1989, as can be seen in the first chart, which shows net and gross profitability of U.K. corporations.
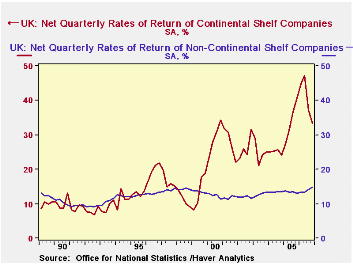 Net profitability is defined as the net rate of return on capital employed. That is, it is the value of profits, allowing for depreciation, divided by the value of inventories and the depreciated value of fixed assets. Gross profitability is defined as the gross return on capital employed, that is, the value of profits before depreciation charges divided by the value of inventories and fixed assets before depreciation . These tend to be lower than the net rates of return, as shown in the first chart.
While the net profitability of Continental Shelf companies (companies engaged in the extraction of oil and gas) declined to 33.5% from 37.3% in the third quarter, the profitability of the nonshelf companies rose to 14.7% from 14.2% in the third quarter. The rates of return for the Continental Shelf corporations are more volatile than those of the nonshelf corporations as can be seen in the second chart. The volatility of the Continental Shelf corporations is due, in large part, to variations in the prices of oil and gas.
Net profitability is defined as the net rate of return on capital employed. That is, it is the value of profits, allowing for depreciation, divided by the value of inventories and the depreciated value of fixed assets. Gross profitability is defined as the gross return on capital employed, that is, the value of profits before depreciation charges divided by the value of inventories and fixed assets before depreciation . These tend to be lower than the net rates of return, as shown in the first chart.
While the net profitability of Continental Shelf companies (companies engaged in the extraction of oil and gas) declined to 33.5% from 37.3% in the third quarter, the profitability of the nonshelf companies rose to 14.7% from 14.2% in the third quarter. The rates of return for the Continental Shelf corporations are more volatile than those of the nonshelf corporations as can be seen in the second chart. The volatility of the Continental Shelf corporations is due, in large part, to variations in the prices of oil and gas.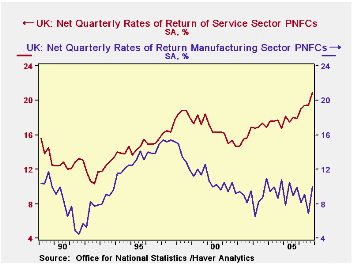
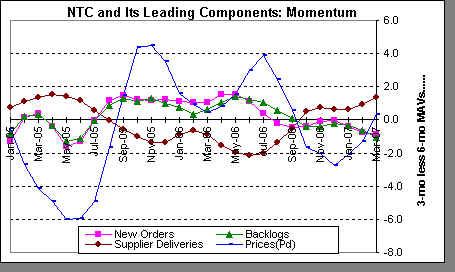 The leading components of the NTC E-zone index are showing mixed trends. We form these trends as the difference between the 3 month and six month indexes. Supplier deliveries and prices-paid are turning up while new orders and order backlog trends are eroding.