Global| Apr 03 2007
Profitability of U.K. Private Nonfinancial Corporations at a Record High: Largely a Reflection of the [...]
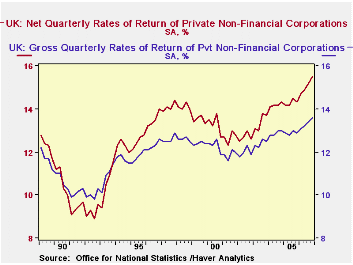 The net profitability of all private nonfinancial corporations in the United Kingdom was 15.5% in the fourth quarter of 2006. This rate was up from 15.2% in the third quarter and was the highest quarterly rate since the series began in the first quarter of 1989, as can be seen in the first chart, which shows net and gross profitability of U.K. corporations.
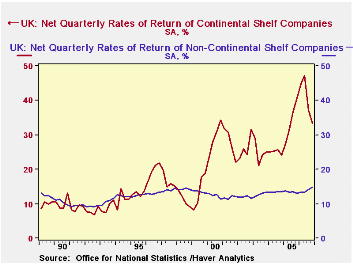 Net profitability is defined as the net rate of return on capital employed. That is, it is the value of profits, allowing for depreciation, divided by the value of inventories and the depreciated value of fixed assets. Gross profitability is defined as the gross return on capital employed, that is, the value of profits before depreciation charges divided by the value of inventories and fixed assets before depreciation . These tend to be lower than the net rates of return, as shown in the first chart.
While the net profitability of Continental Shelf companies (companies engaged in the extraction of oil and gas) declined to 33.5% from 37.3% in the third quarter, the profitability of the nonshelf companies rose to 14.7% from 14.2% in the third quarter. The rates of return for the Continental Shelf corporations are more volatile than those of the nonshelf corporations as can be seen in the second chart. The volatility of the Continental Shelf corporations is due, in large part, to variations in the prices of oil and gas.
Net profitability is defined as the net rate of return on capital employed. That is, it is the value of profits, allowing for depreciation, divided by the value of inventories and the depreciated value of fixed assets. Gross profitability is defined as the gross return on capital employed, that is, the value of profits before depreciation charges divided by the value of inventories and fixed assets before depreciation . These tend to be lower than the net rates of return, as shown in the first chart.
While the net profitability of Continental Shelf companies (companies engaged in the extraction of oil and gas) declined to 33.5% from 37.3% in the third quarter, the profitability of the nonshelf companies rose to 14.7% from 14.2% in the third quarter. The rates of return for the Continental Shelf corporations are more volatile than those of the nonshelf corporations as can be seen in the second chart. The volatility of the Continental Shelf corporations is due, in large part, to variations in the prices of oil and gas.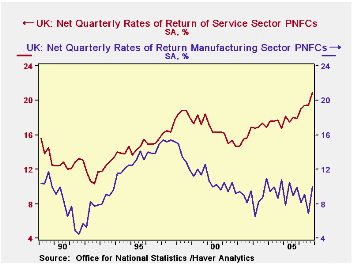
Of the nonshelf companies, it is the corporations engaged in the service industries that have accounted for the rise in the overall profitability of the private nonfinancial companies. Net profitability in the service and manufacturing industries are compared in the third chart. Rates of return in the manufacturing industry tend to be lower than those in the service industries due, in part, to the greater capital intensity of the manufacturing industry relative to that of the service industry corporations, but the gap between rates of return in the manufacturing and service industries has widened as profitability in the service industries has improved and that in the manufacturing industries deteriorated.
| NET PROFITABILITY OF PRIVATE NON FINANCIAL CORPORATIONS IN THE UK (%) | Q4 2006 | Q3 2006 | Q4 2005 | Q/Q Dif | Y/Y Dif | 2006 | 2005 | 2004 |
|---|---|---|---|---|---|---|---|---|
| All Corporations | 15.5 | 15.2 | 14.3 | 0.3 | 1.2 | 15.1 | 14.3 | 14.2 |
| Continental Shelf Corporations | 33.5 | 37.3 | 40.6 | -3.8 | -7.1 | 40.7 | 34.1 | 25.1 |
| Nonshelf Corporations | 14.7 | 14.2 | 13.0 | 0.5 | 1.7 | 13.9 | 13.4 | 13.5 |
| Manufacturing Corporations | 10.0 | 6.9 | 9.9 | 3.1 | 0.1 | 8.5 | 9.3 | 9.7 |
| Service Industry Corporations | 20.9 | 19.5 | 17.9 | 1.4 | 3.0 | 19.7 | 17.9 | 17.4 |
More Economy in Brief
United Kingdom| Jul 22 2026
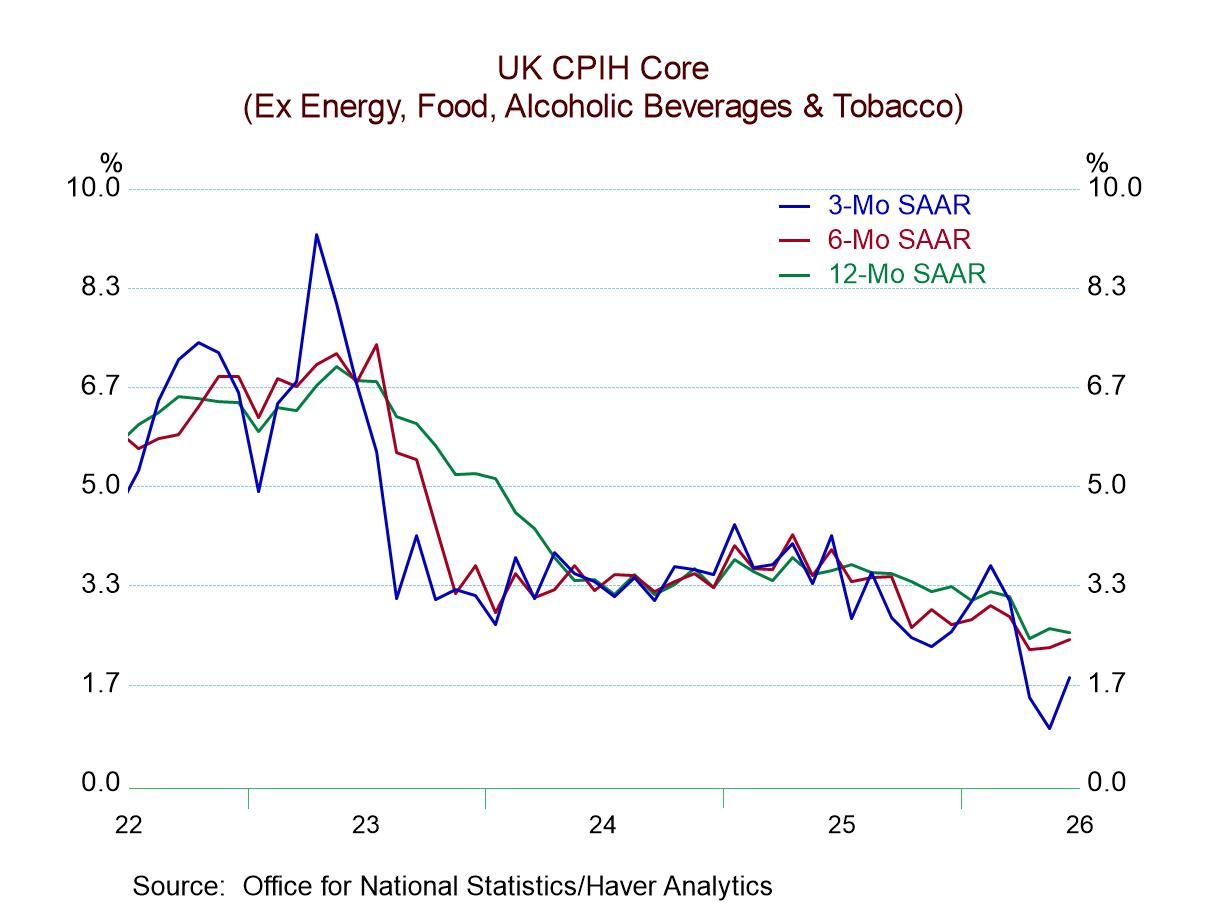
U.K. Headline and Core Inflation Rates Slow Sequentially as BOE Gets Ready to Meet