 Global| Apr 04 2007
Nonmanufacturing ISM: Sharp Two-Month Drop Off
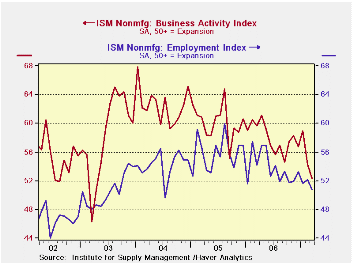 ISM trends show a weakening trend in the services-mining-construction sector of the economy to add to the lethargy in manufacturing. The past two months show that the index has dropped to a much lower profile than before. This is the weakest activity recorded since early 2003. Employment trend has been ground into a lower profile as well. The results are disconcerting although it may be that ongoing construction problems are weighing on the index and services are not as weak as the index suggests.
An analysis of the position of the various ISM components in their respective ranges shows that weakness characterizes this sector. Both activity and orders are below their range midpoints and below their period average values. Order backlogs continue to appear strong as an offset, as we have seen in durable goods order report. Unlike the ISM manufacturing we see that export and import services are weak. For manufacturing these two series were quite firm. Price readings rose in the month and remain firm in their historic range. On balance, the nonmanufacturing sector does not appear to be as strong or supportive of the economy as it once was. It raises the question of whether the weakness in manufacturing and construction industries has ground down the once vibrant services sector that is nested within the nonmanufacturing ISM.
| ISM Nonmanufacturing Statistics from January 1998 to Date | |||||||||
|---|---|---|---|---|---|---|---|---|---|
| ISM-NMFG | Current | Std Dev | Average | SD %Avg | MAX | MIN | Range | Percentile | % of AVG |
| PM Activity | 52.4 | 4.7 | 57.5 | 8.2 | 67.9 | 40.5 | 27.4 | 43.4 | 91 |
| New Orders | 53.8 | 4.7 | 57.2 | 8.2 | 66.9 | 41.3 | 25.6 | 48.8 | 94 |
| Backlogs | 52.5 | 3.7 | 51.0 | 7.2 | 57.0 | 40.5 | 16.5 | 72.7 | 103 |
| Supplier Deliveries | 50.0 | 2.1 | 53.6 | 4.0 | 60.5 | 48.0 | 12.5 | 16.0 | 93 |
| Inventory Sentiment | 63.0 | 2.7 | 63.1 | 4.3 | 69.0 | 55.0 | 14.0 | 57.1 | 100 |
| Inventories | 52.0 | 3.2 | 50.5 | 6.2 | 59.0 | 43.5 | 15.5 | 54.8 | 103 |
| Prices | 63.3 | 8.3 | 59.8 | 13.9 | 80.5 | 41.3 | 39.2 | 56.1 | 106 |
| Employment | 50.8 | 3.7 | 51.7 | 7.1 | 59.9 | 43.9 | 16.0 | 43.1 | 98 |
| Export Orders | 48.5 | 4.5 | 54.8 | 8.3 | 64.0 | 44.5 | 19.5 | 20.5 | 89 |
| Import Orders | 50.0 | 4.0 | 54.7 | 7.4 | 63.5 | 45.5 | 18.0 | 25.0 | 91 |
by Robert Brusca April 4, 2007
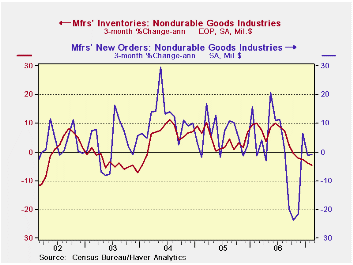 Each month the factory order report is a re-issue of durable goods from the week before with (usually) minor revisions plus a new look at nondurable goods shipments and inventories. This month the durable goods order gain was trimmed from a small rise of 2.5% to an even tinier rise of 1.7% for February following a plunge in January. The new data for February are for nondurable goods. Orders there rose by a meager 0.2% in the month. Over three months they are weak with shipments dropping by 1%. But the good news is that progress on inventory reduction is in train as inventories dropped by 4.4% in February.
The overall trends for the factory sector cut into three month blocks shows some revival in shipments compared to past trends. And there is a relatively sharp fall off in (still high) unfilled orders. Inventories are undergoing a gradual slowing in their build up. New orders continue to drop and at a slightly accelerated pace.
Each month the factory order report is a re-issue of durable goods from the week before with (usually) minor revisions plus a new look at nondurable goods shipments and inventories. This month the durable goods order gain was trimmed from a small rise of 2.5% to an even tinier rise of 1.7% for February following a plunge in January. The new data for February are for nondurable goods. Orders there rose by a meager 0.2% in the month. Over three months they are weak with shipments dropping by 1%. But the good news is that progress on inventory reduction is in train as inventories dropped by 4.4% in February.
The overall trends for the factory sector cut into three month blocks shows some revival in shipments compared to past trends. And there is a relatively sharp fall off in (still high) unfilled orders. Inventories are undergoing a gradual slowing in their build up. New orders continue to drop and at a slightly accelerated pace. Sector detail for nondurables shows a lot of weakness. Beverages are weak as are the Textile Mill and Product sectors. For Textiles inventory reduction is being achieved at a very rapid pace. Apparel has just turned positive and Leather Goods shows considerable strength. Paper Products and Printing are weak with shipments declining. Petroleum & Coal and Plastics & Rubber also are seeing shipment declines. Basic Chemicals and Pharmaceuticals & Medicines have turned sharply positive.
These are the readings that are new in the day’s report. They are hardly encouraging.
| Factory Orders | 3Mo | 6Mo | 9Mo | 12Mo | Year Ago | |
| Shipments | -3.5% | -9.4% | -5.6% | -1.0% | 6.6% | |
| New Orders | -9.0% | -7.8% | -4.9% | -0.8% | 7.1% | |
| Unfilled Orders | 14.5% | 23.6% | 20.3% | 20.8% | 17.0% | |
| Inventories | 1.0% | 2.8% | 5.0% | 6.4% | 2.5% | |
| Nondurable goods | 3Mo | 6Mo | 9Mo | 12Mo | Year Ago | |
| Shipments | -1.0% | -11.8% | -7.8% | -1.3% | 5.0% | |
| Inventories | -4.4% | -3.3% | 0.2% | 2.2% | 4.0% | |
| Nondurable Goods: Orders and Inventories by Industry | ||||||
| Food Products | 3Mo | 6Mo | 9Mo | 12Mo | Year Ago | |
| Shipments | 1.7% | 1.2% | 2.0% | 0.5% | 0.9% | |
| Inventories | -0.9% | 6.3% | 6.3% | 4.5% | 4.3% | |
| Beverages | 3Mo | 6Mo | 9Mo | 12Mo | Year Ago | |
| Shipments | -20.7% | -12.9% | -7.4% | 0.1% | 7.4% | |
| Inventories | 3.0% | 3.2% | 1.3% | -0.7% | 4.2% | |
| Textile Mills | 3Mo | 6Mo | 9Mo | 12Mo | Year Ago | |
| Shipments | -3.6% | -2.4% | -3.0% | -3.1% | -12.6% | |
| Inventories | -25.3% | -16.2% | -8.1% | -8.8% | -7.9% | |
| Textile Products | 3Mo | 6Mo | 9Mo | 12Mo | Year Ago | |
| Shipments | -4.1% | -8.6% | -11.9% | -8.5% | 3.9% | |
| Inventories | -11.6% | -9.2% | -1.3% | -2.6% | -0.6% | |
| Apparel | 3Mo | 6Mo | 9Mo | 12Mo | Year Ago | |
| Shipments | 0.8% | 3.7% | -8.6% | -1.9% | 8.0% | |
| Inventories | 7.4% | -22.6% | -12.4% | -9.2% | -1.1% | |
| Leather & Allied Products | 3Mo | 6Mo | 9Mo | 12Mo | Year Ago | |
| Shipments | 105.8% | 14.9% | 16.7% | 10.1% | -2.9% | |
| Inventories | 23.4% | 7.4% | 15.1% | 11.9% | -9.0% | |
| Paper Products | 3Mo | 6Mo | 9Mo | 12Mo | Year Ago | |
| Shipments | -2.6% | -5.5% | -5.3% | -1.5% | 1.1% | |
| Inventories | 5.8% | 2.9% | 0.4% | 1.9% | -1.9% | |
| Printing | 3Mo | 6Mo | 9Mo | 12Mo | Year Ago | |
| Shipments | -7.0% | 0.4% | 1.1% | 3.5% | -3.1% | |
| Inventories | -15.8% | -16.6% | -2.0% | 0.7% | -2.1% | |
| Petroleum&Coal | 3Mo | 6Mo | 9Mo | 12Mo | Year Ago | |
| Shipments | -1.3% | -32.7% | -23.7% | -5.3% | 17.2% | |
| Inventories | -15.5% | -30.4% | -19.2% | 4.5% | 16.3% | |
| Basic Chemicals | 3Mo | 6Mo | 9Mo | 12Mo | Year Ago | |
| Shipments | 4.7% | -10.3% | -5.9% | 0.2% | 4.0% | |
| Inventories | -0.4% | -1.0% | 1.7% | 1.9% | 2.9% | |
| Pharmaceuticals & Medicine | 3Mo | 6Mo | 9Mo | 12Mo | Year Ago | |
| Shipments | 19.6% | -6.5% | -6.8% | 6.3% | -1.0% | |
| Inventories | -7.4% | -1.1% | 5.5% | 11.0% | -4.6% | |
| Plastics & Rubber Products | 3Mo | 6Mo | 9Mo | 12Mo | Year Ago | |
| Shipments | -6.6% | -12.5% | -7.0% | -3.7% | 7.0% | |
| Inventories | 6.5% | 5.0% | 1.0% | 0.7% | 4.6% | |
by Carol Stone April 4, 2007
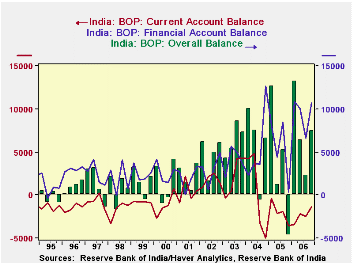
India's balance of payments shows an unusual amount of two-way flow in both current and financial accounts. In Q4 2006 this encompassed a variety of distinctive movements. The trade deficit widened, continuing to confound many observers' preconceptions that India shouldn't have a deficit in this account at all. Petroleum is apparently the main cause, as suggested by the second graph here. It shows merchandise imports less petroleum plotted with merchandise exports, and these two quantities have roughly the same magnitudes.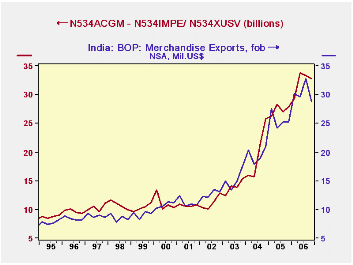
The overall current account is much more near balance, as sizable surpluses in services and unilateral transfers offset much of the trade shortfall. In fact, the net on services in Q4, right at $9.0 billion, is nearly twice as much as it was in Q4 of 2005. This is the numerical result of the "outsourcing" of many business service activities by companies elsewhere in the world. Many Indians work abroad and send money home. Private transfers in Q4 were $7.9 billion, up $1.5 billion from the same period a year ago. The balances on services and transfers were both record amounts.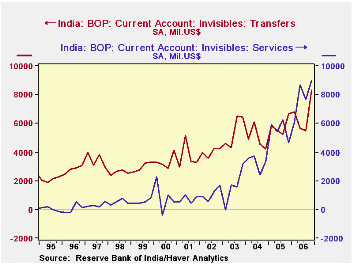
Capital accounts feature sizable -- unprecedented -- direct investment flows in BOTH directions. Foreign firms acquired Indian companies and Indian companies made acquisitions abroad. Foreign investors also increased their portfolio holdings, as they bought into the Indian stock market. Other capital account transactions, including bank loans and bank deposits and assorted other kinds of lending also showed great fluidity: Indian banks made sizable loans abroad, while nonbank lending to India grew sharply.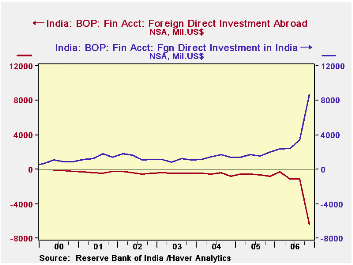
All together, the "overall balance" in Q4 was $7.5 billion, with a commensurate increase in foreign exchange reserves. This is sizable, and such numbers are getting to be common. For 2006 as a whole, the balance totaled $29.4 billion, also a record. Such accumulations of foreign exchange will enable more flows abroad, such as the outward investments recently seen.
Haver's data on India is contained in the EMERGEPR database.
| INDIA1: Mil.US$ | Q4 2006 | Q3 2006 | Q4 2005 | 2006 | 2005 | 2004 |
|---|---|---|---|---|---|---|
| Current Account2,3 | -1,321 | -2,465 | -3,549 | -10,006 | -7,810 | +781 |
| Merchandise Trade2 | -18,251 | -14,346 | -12,400 | -63,783 | -46,872 | -28,036 |
| Services2 | +8,995 | +7,650 | +4,643 | +31,428 | +22,259 | +13,076 |
| Transfers2 | +8,282 | +5,503 | +6,631 | +26,290 | +23,234 | +19,793 |
| Direct Investment in India | +8,669 | +3,414 | +2,002 | +16,888 | +6,663 | +5,771 |
| Direct Investment Abroad | -6,388 | -1,146 | -784 | -9,029 | -2,487 | -2,179 |
| Portfolio Investment | +3,556 | +2,141 | +2,748 | +9,503 | +12,144 | +9,037 |
| Overall Balance3 | +7,507 | +2,268 | -4,672 | +29,372 | +14,460 | +23,601 |

Robert Brusca
AuthorMore in Author Profile »Robert A. Brusca is Chief Economist of Fact and Opinion Economics, a consulting firm he founded in Manhattan. He has been an economist on Wall Street for over 25 years. He has visited central banking and large institutional clients in over 30 countries in his career as an economist. Mr. Brusca was a Divisional Research Chief at the Federal Reserve Bank of NY (Chief of the International Financial markets Division), a Fed Watcher at Irving Trust and Chief Economist at Nikko Securities International. He is widely quoted and appears in various media. Mr. Brusca holds an MA and Ph.D. in economics from Michigan State University and a BA in Economics from the University of Michigan. His research pursues his strong interests in non aligned policy economics as well as international economics. FAO Economics’ research targets investors to assist them in making better investment decisions in stocks, bonds and in a variety of international assets. The company does not manage money and has no conflicts in giving economic advice.
More Economy in Brief


