- Sales fall to lowest level in two years.
- Decline spreads throughout the country.
- Median sales price continues to increase.
 USA| May 24 2022
U.S. New Home Sales Plunge in April as Prices Jump
by:Tom Moeller
|in:Economy in Brief
 USA| May 24 2022
U.S. Energy Prices Rise Further
- Gasoline prices jump to another record high.
- Crude oil prices strengthen.
- Natural gas prices rise to highest level since February 2021.
by:Tom Moeller
|in:Economy in Brief
 USA| May 23 2022
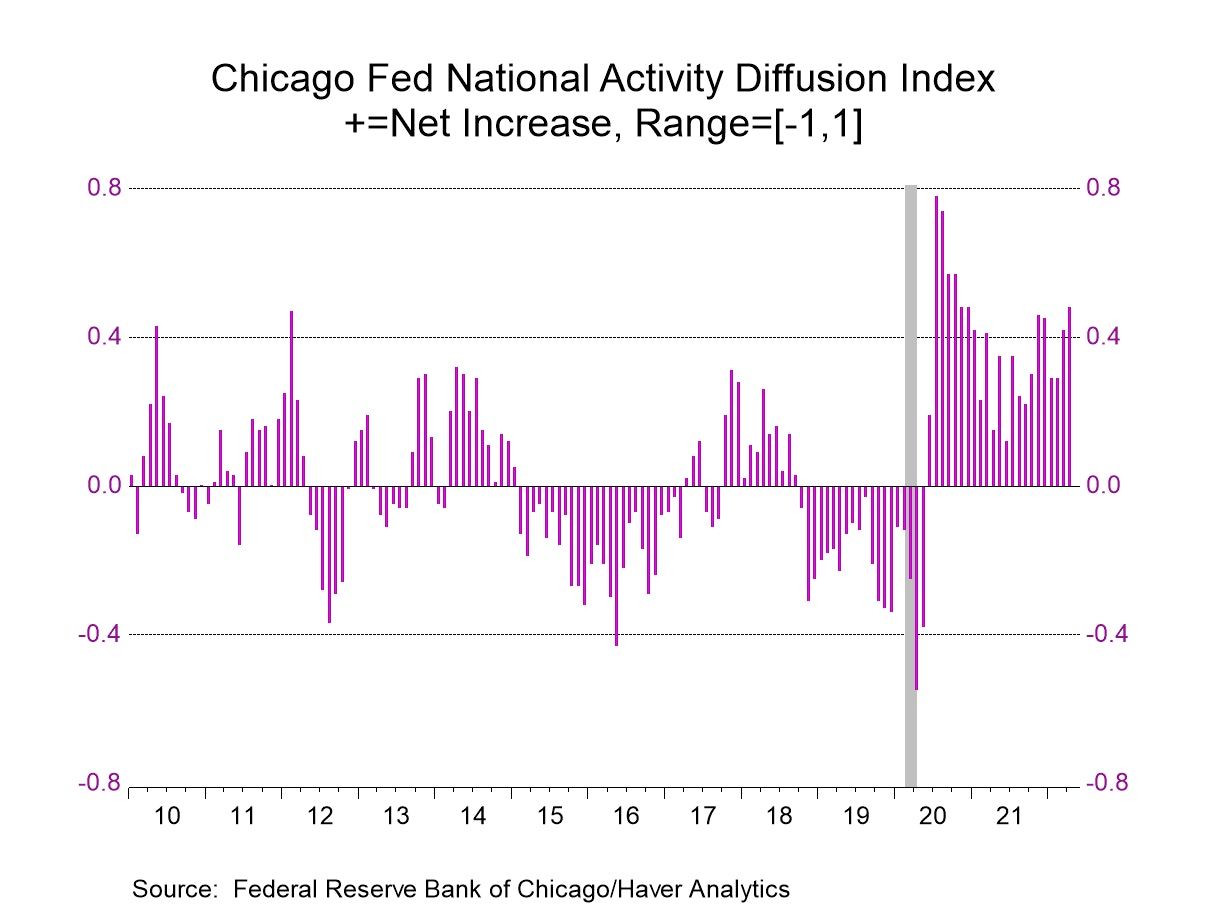
Chicago Fed National Activity Index Improves in April
- Three of four major components rise marginally m/m.
- Three-month moving average slips.
by:Tom Moeller
|in:Economy in Brief
 USA| May 23 2022
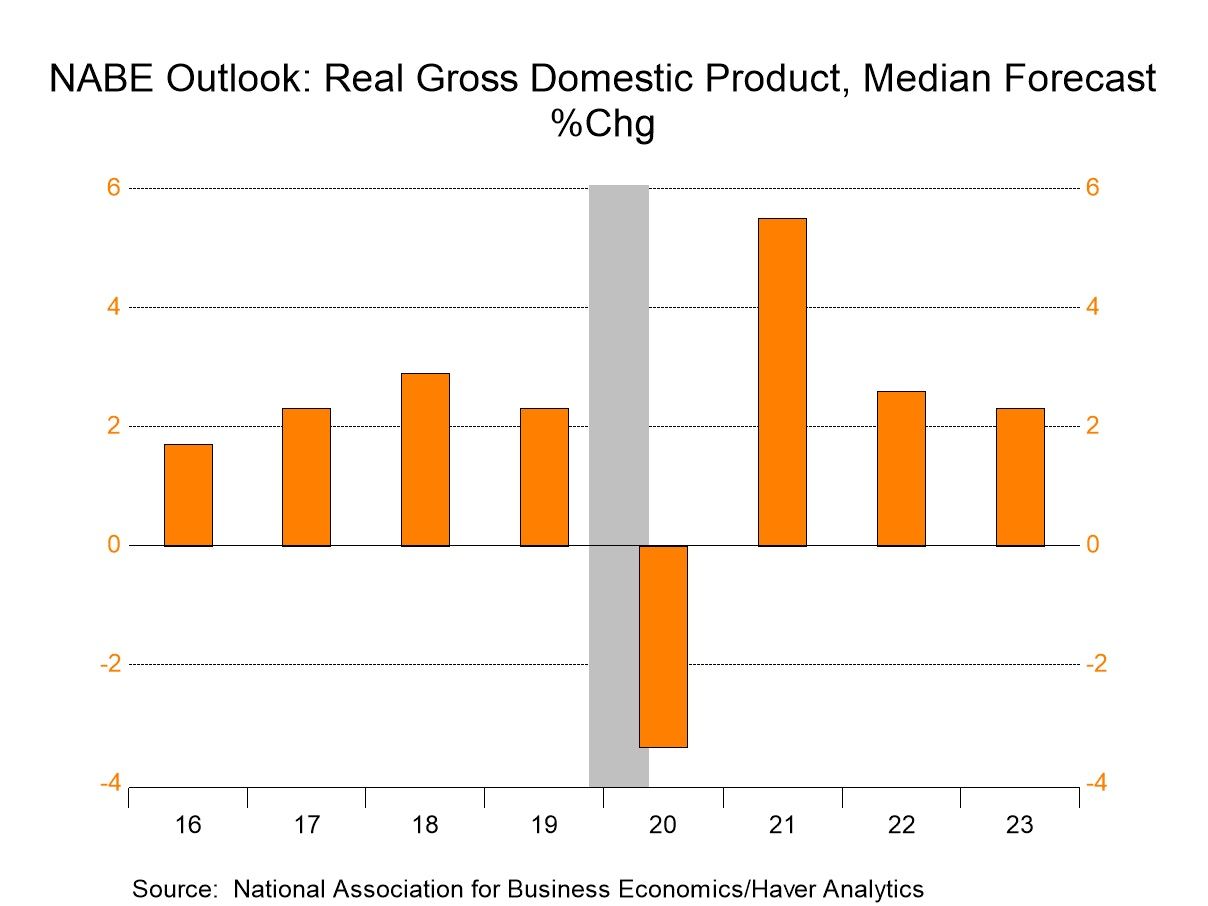
NABE Lowers Growth Expectations for Next Year & 2022
- Consumer spending growth is reduced; capital spending is raised.
- Housing starts are predicted to ease. Vehicle sales growth is trimmed.
- Price inflation and interest rate estimates are raised.
by:Tom Moeller
|in:Economy in Brief
 United Kingdom| May 20 2022
U.K. Consumer Sentiment Hits Lowest Reading since 1996 (When the GfK Survey Began; Also Lowest Reading 'Ever')
Consumer sentiment in the United Kingdom fell in May of 2022 dropping to its lowest reading since 1996 when the GfK survey began. GfK consumer sentiment in May fell to a level of -40 from -38 in April. The reading had been at -31 in March it has fallen steadily over the past six months. The GfK metric average is -19 over 12-months. -28 over 6-months and -36 over 3-months. Sentiment in the U.K. has been steadily falling.
What is most disturbing about the U.K. sentiment figures is that this is a new low, meaning that it is even below the low levels reached when COVID struck and also below the low levels for sentiment during the period of Brexit uncertainty. These are two recent major events quite apart from the recessions run since 1996 that occurred over this span, and, in May, with a lot of uncertainty and global issues in the mix, the U.K. now shows the lowest sentiment reading on record. This is a rating that's competing with some pretty stiff company historically for 'worst ever,' making the new low against this competition is a disturbing phenomenon.
Including the headline there are 13 readings in the table for sentiment. Of these 13 readings eight of them declined on the month in May three of them improved and two of them were unchanged. This compares to April when ten fell and three rose and to March when eight of them fell and five rose. The clear tilt has been for more of the components to show weakness than strength each month. The headline has declined for six months in a row. So sentimentally U.K. has seen a very steady ongoing erosion. OF course some of the reading that rise recollect bad news such as for inflation, expected inflation and expected unemployment. Over the last six months of these 3 categories (inflation expected inflation and expected unemployment) there are 18 observations of which 13 have gotten worse month to month.
Turning to the standings most of the readings are weak. The exception, of course, is the ranking for CPI inflation over the last 12 months which is in its 99th percentile as well as expectations for the CPI over the next 12 months which is also in its 99th percentile. Another exception that is unfortunate is the 74.7 percentile standing for unemployment expected over the next 12 months. That's a relatively high standing. We can take it as an 'approximation' of people's fear of recession. After that, the next highest reading is the current reading for savings which has a 54.6 percentile standing, just above its historic median.
The remaining indicators show extreme weakness. I refer you to the table to see the specific numbers but the percentile standings for the range of observations not yet discussed consist of a range from a high at the 22nd percentile to a low at the 0.3 percentile. All of these are undeniably weak and clearly and substantially below the median reading that occurs at a ranking of 50th percentile for each category. The household financial situation is weak the environment for making major purchases also is weak and that environment has worsened in each of the last three months, and it's part of a string of weakening that extends back for the last six months.
Looking at the last 12-months the environment for making a major purchase and the general economic situation for 12-months ahead have both worsened for five months in a row. The household financial situation ticked up slightly in May after three consecutive months of falling significantly in each of those months
Looking ahead to other metrics for the next 12 months, prospects for unemployment have been rising or unchanged for six months in a row, a chilling development.
Confidence expressed by general income classes the 'lower' and the 'upper' income classes show little difference with both of them giving extremely low rankings. Upper income class sentiment has fallen in four of the last five months and lower income class sentiment has fallen in four the last six months.
The GfK barometer is worrisome. It's worrisome because it competes with some bad events and still gives us a weaker reading than any of those historic events. It comes with the Bank of England fighting a very difficult inflation fight along with other global central banks. It comes at a time when there is a war being waged by Russia on Ukraine that is straining the global economy. It's a war that Russia is using to degrade global feedstock and to spread hunger and panic globally because countries will not roll over and accept its desire to dominate and control Ukraine.
This may not be a situation that qualifies as a 'World War'. But this is a situation in which there are two countries at war and one of them is acting to put the entire world in a disadvantaged state by helping to drive up oil prices, other commodity prices, and by purposely depriving non-combatant countries access to needed food stocks. The impact on low income developing countries is going to be severe. There will be hunger. Some will die of hunger. All of this comes because Russia refuses to abide by the Budapest memorandum which had signed, pledging to defend Ukraine's borders. And further because of its refusal to abide by Post War conventions that outlawed cross border incursions to seize territory. It is still not clear how China, a country that lays strong territorial claims to Taiwan, is absorbing the news of how the world has come together to defend Ukraine. However, the impact of these global events on U.K. consumer sentiment is nothing short of disastrous.
 USA| May 20 2022
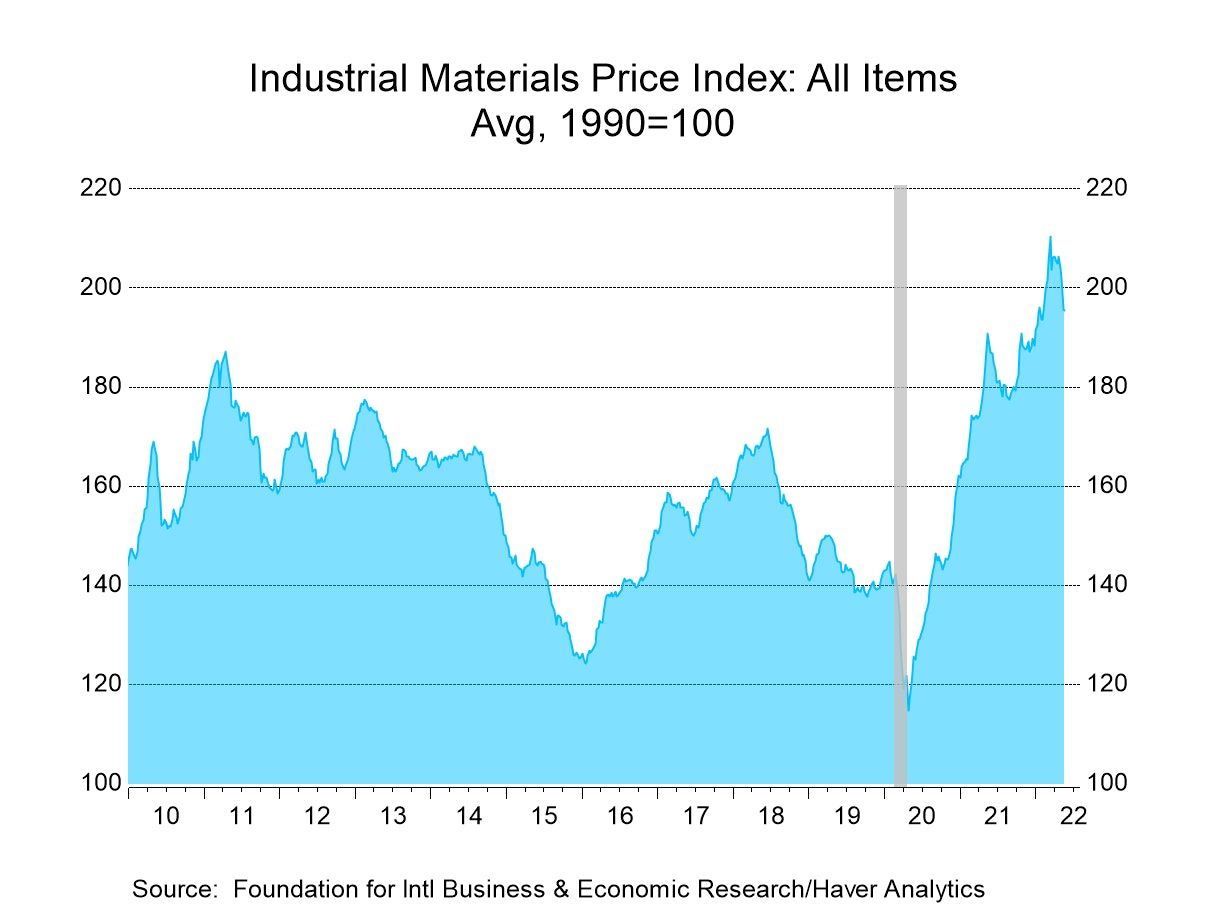
FIBER: Industrial Commodity Prices Continue to Decline
- Metals & lumber prices move sharply lower.
- Prices elsewhere are mixed.
by:Tom Moeller
|in:Economy in Brief
 USA| May 19 2022
U.S. Unemployment Claims Rose in the Latest Week
- Initial claims rose 21,000 to 218,000, the highest claimants' level since January 29.
- Continued weeks claimed fell again to its lowest level since late 1969.
- The insured unemployment rate hit a new record low of 0.9%.

- Sales post their third consecutive decline.
- Median home price hits record level.
- Higher prices and mortgage rates are driving down affordability.
- of2727Go to 439 page