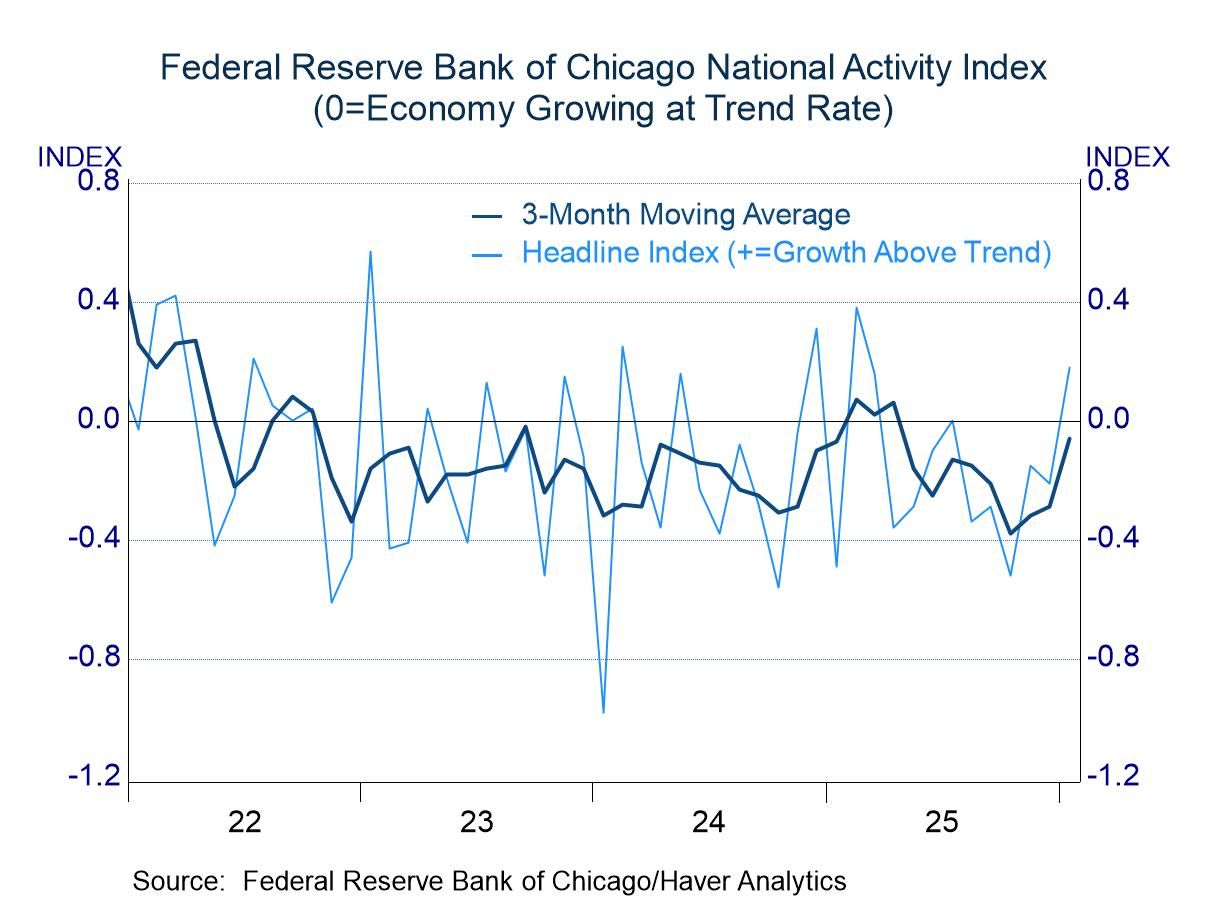
- January results showed noticeable improvement from prior months.
- All four components contribute positively.
 Germany| Feb 23 2026
German IFO: Business Confidence Claws Its Way Out of a Hole
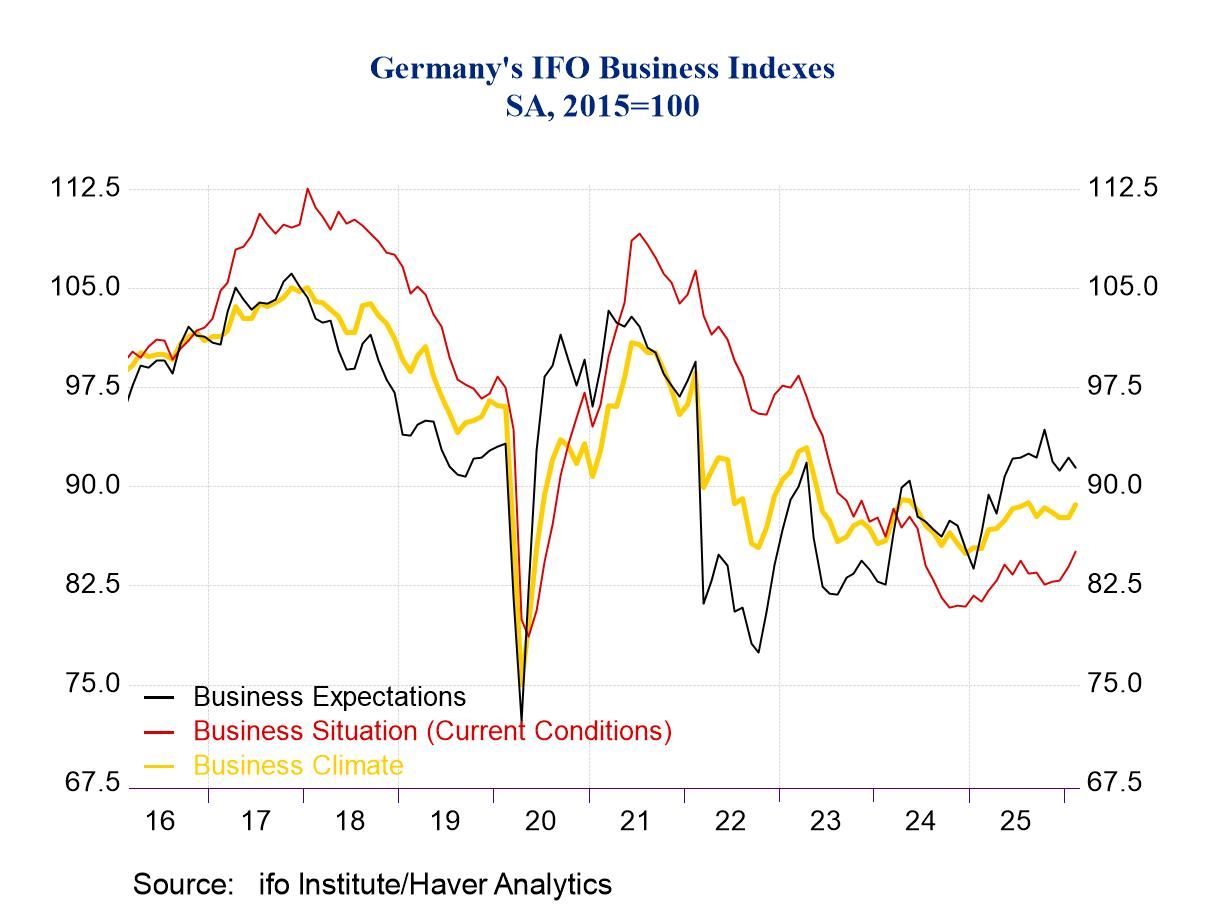
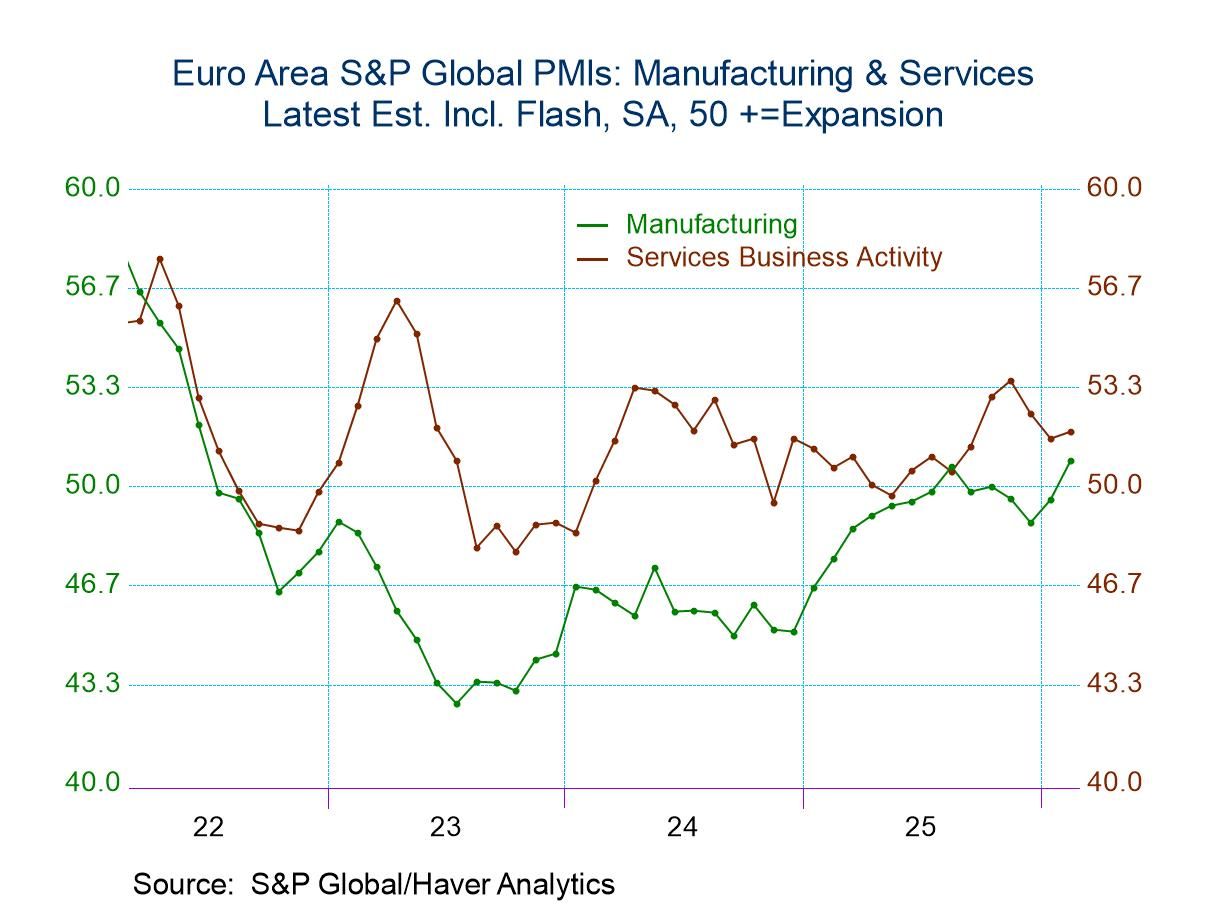
Germany's IFO index shows improvement in February compared to January. The climate index improves, the current conditions index improves, and expectations improve. All three all-sector headlines improve in February compared to January. However, all three metrics continue to register net negative readings, indicating that the sectors are showing more contraction than expansion, but less contraction than it had been the case previously. We ranked these headlines on data back to 1993; the climate index has a 22.5 percentile standing, expectations have a 22.4 standing, and current conditions have a 16.9 percentile standing. All three of the headline metrics have standings in the lower quartile of their queue of values back to the early 1990s. This is clearly not a stellar report but a report from an economy that is struggling. Even though it's widely reported that the climate index is currently on a six-month high; it may be on a six-month high, but it's not really much different than it was six months ago and only up by 1.1% from its lowest mark in the intervening five months—so not impressive. This is a grueling, crawling, dig-out from difficult circumstances. The COVID pandemic was a sucker punch to the global economy, and it was followed by the Russian invasion of Ukraine that hit Europe especially hard because of the proximity.
Since then, other geopolitical tensions have risen. Europe's relationship with the United States has deteriorated, in part because Europe—Germany in particular—was reluctant to detach itself from its mercantile relationships with Russia and was also reluctant to increase its financial participation in NATO. The U.S. was carrying the burden of the protective umbrella for Europe at a time when Europe didn't really think it needed a protective umbrella and so it was unwilling to pay for anything more substantial. When the rainy day came and when the Russian invasion of Ukraine occurred, Europe was completely unprepared and the U.S. was its protector. While Germany and other European countries quickly made it clear that they were fully on board with NATO defense, the U.S. was much less enthusiastic about carrying the burden after Europe had put its financial probity ahead of its defense spending obligations. Now Europe does not see the U.S. and its perceived greater needs for security because of improved navigation from the Arctic Circle to the North Atlantic.
These troubles continue to dog the relationship between the United States and Europe, and the European Community. And Europe’s own economic struggles continue. In the climate readings, all four of five sectors improve from January to February. Current conditions improve in three of the five sectors, with retailing and wholesaling slipping month-to-month. Expectations do improve overall, but three of five sectors take a step back in February, with expectations improving sharply for services, and substantively for wholesaling. Still manufacturing, construction, and retailing expectations stepped back.
Across the three broad areas of assessment across five sectors in each, there are only two (two of fifteen) sector metrics that rank above their 50th percentile (above their respective medians) when ranked against readings back to 1993. Both of those elevated rankings are for construction, one for Climate, and the other for current conditions, but construction expectations, at a 44.5 percentile standing, are not far below their median.
Still, the lowest environmental standings are for services, except under expectations where the services reading is second-weakest to retailing. The graphic shows some tendency for an upturn in climate and current conditions, but they are countered by an expectations path that has topped out and has been gradually leaning lower—and doing that with a current ranking in only its 22.5 percentile. So, while there is some life in the IFO survey this month, we are still looking at a patient in intensive care, not one ready to join Olympic competition—at least not yet.
 Asia| Feb 23 2026
Economic Letter from Asia: Asia and AI
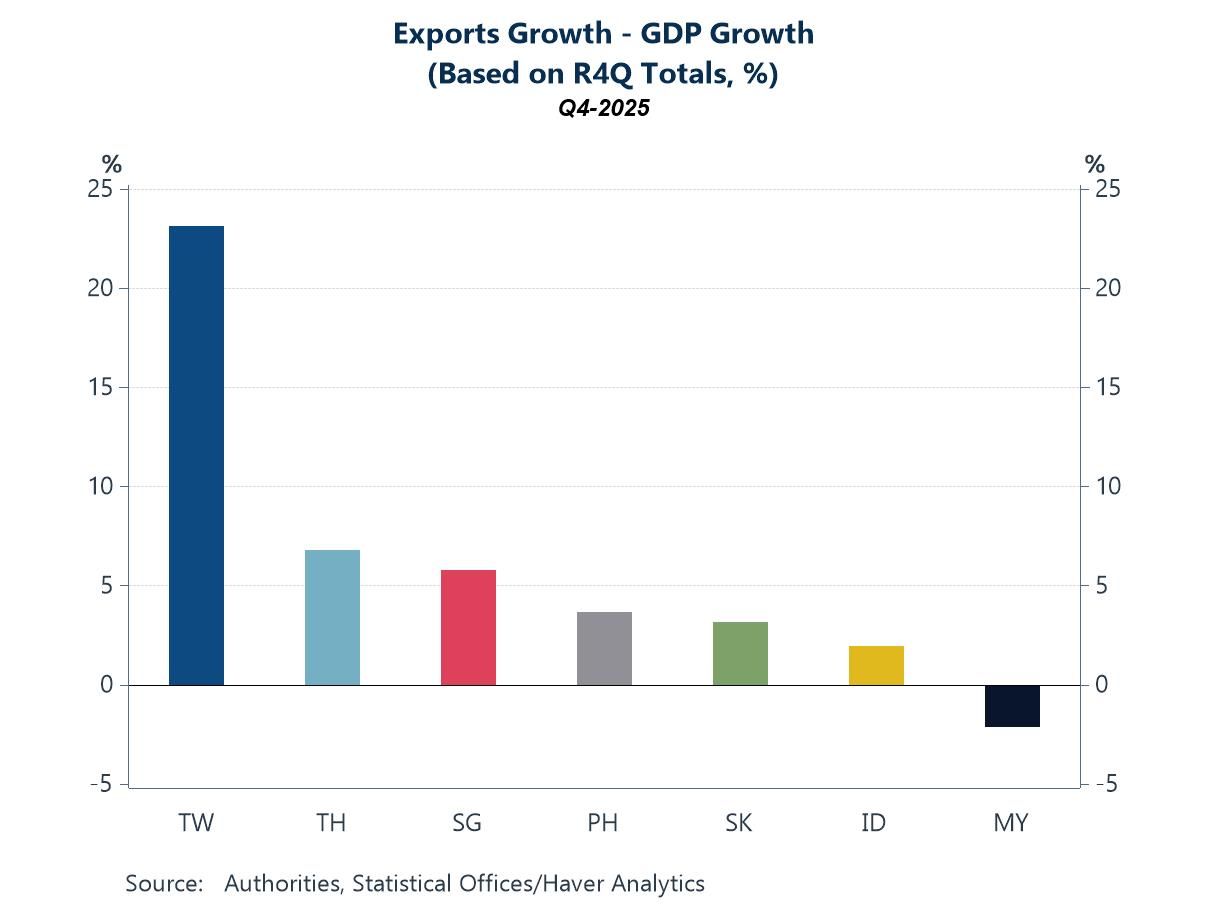
In our Letter this week, we delve deeper into AI, with a focus on Asia and, where relevant, comparisons with the US. The global economy remains firmly in the buildout phase of AI, where much of the near-term economic benefit is derived from investment in hardware and enabling infrastructure—such as AI chips, memory, and data centres. At the same time, though still at a relatively early stage, firms are beginning to adopt advanced AI capabilities and integrate them into workflows in pursuit of productivity gains. So far, labour productivity improvements have been evident in parts of Asia (chart 1), largely driven by stronger exports (chart 2) and capital deepening—similar to trends observed in the US (chart 3) and, within Asia, in economies such as Malaysia (chart 4). However, these gains have yet to translate into a clear and sustained acceleration in total factor productivity (TFP), which accounts for the combined use of labour, capital, and other inputs—though TFP is admittedly a challenging metric to estimate, as illustrated by the US case (chart 5). This raises an important question: what happens when the AI buildout phase begins to moderate, and the associated investment-led tailwinds fade? At that point, further AI-related gains will depend more heavily on the successful embedding and diffusion of AI across sectors. On this front, Asian economies remain at very different stages of readiness to adopt AI (chart 6), suggesting that the next phase of productivity gains may be uneven across the region.
The productivity story Several Asian economies have already recorded substantial productivity gains in recent years, even before the narrative around AI-driven productivity boosts gained traction last year. As shown in chart 1, measured by labour productivity—simply defined as output per employed person—economies such as Taiwan and several in Southeast Asia stand out for their strong performance. However, these gains cannot be attributed solely to the promise of AI. By definition, labour productivity rises whenever output (the numerator) grows faster than employment (the denominator). Such an outcome can stem from a range of factors—cyclical recoveries, capital deepening, sectoral shifts, or efficiency improvements—and does not necessarily reflect widespread AI adoption.
 USA| Feb 20 2026
Q4 GDP: Constrained by Federal Spending
- Non-federal activity was lighter than expected, but still respectable.
- PCE inflation remains stubborn.
 USA| Feb 20 2026
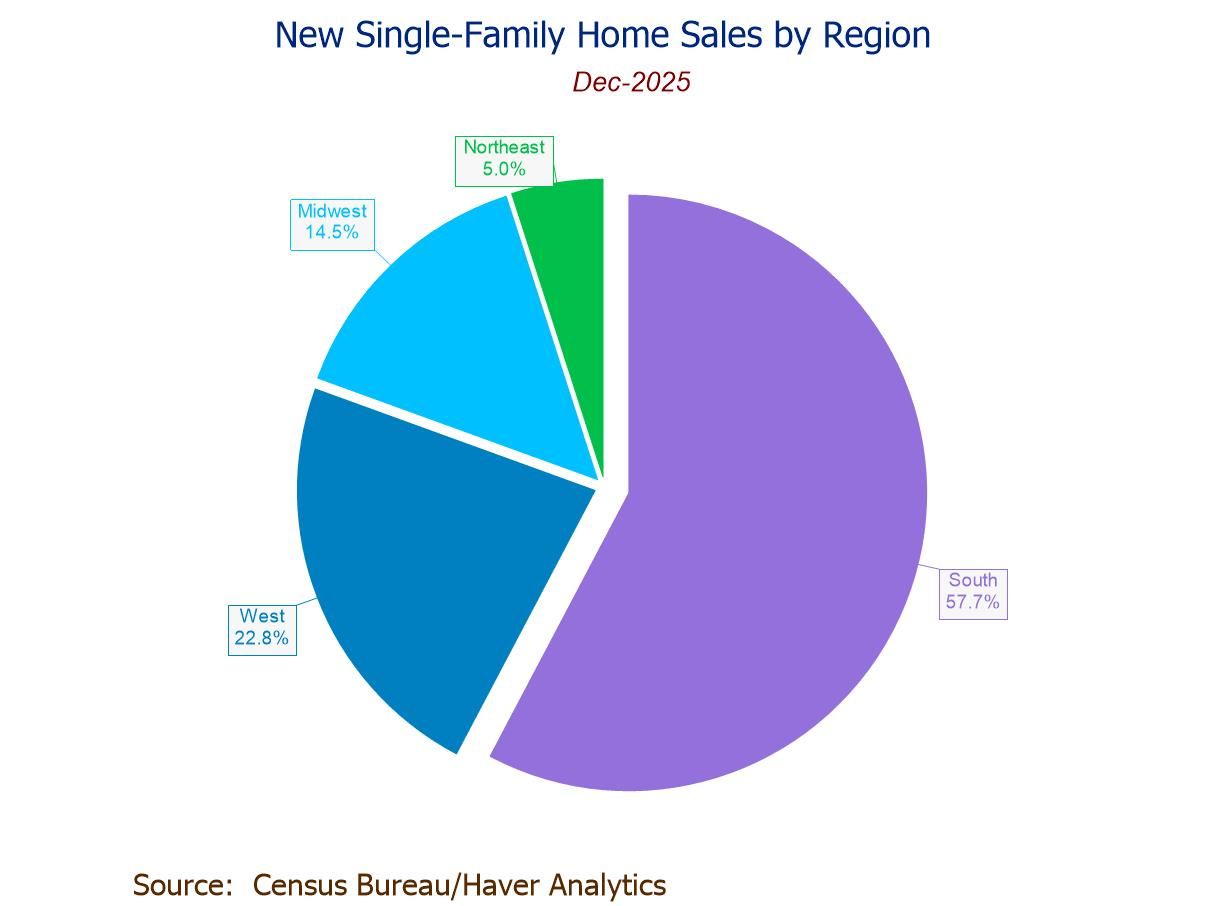
U.S. New Home Sales Decline in December After November’s Jump
- December sales -1.7% m/m (+3.8% y/y) to 745,000; still 43.5% above the July ’22 low.
- Sales m/m down the Northeast (-37.3%) and South (-6.7%), but up in the Midwest (+31.7%) and West (+9.0%).
- Median sales price up to a three-month-high $414,400; avg. price up to $532,600, highest since July ’22.
- Months' supply eases to 7.6 mths., lowest since July ’23.
 Global| Feb 20 2026
S&P PMIs Are Mostly Stronger in February
PMI data for February, issued by S&P on a flash basis, show relatively broad improvement PMI performance in February, with the exception of Australia, India, and the United States. The European Monetary Union shows improvement in its composite index as well as for manufacturing and services. This pushed to higher ratings, supported by Germany and France with the exception that French manufacturing took a step back in February. In the United Kingdom, the composite and manufacturing indexes moved ahead but services weakened. In Japan, the composite, manufacturing and services all improved on a month-to-month basis. However, Australia saw a step back in all three sectors after several months of continued strengthening. India also saw a step back in the composite and services after a recent string of improvements being reported. The United States shows uneven conditions, with a weakening across the board month-to-month in February vs. an across-the-board rebound in January, and then across-the-board weakening in December. This leaves the U.S. in a weakening and volatile situation
An unweighted average of the monthly composite, manufacturing, and services indexes shows a one-tick step back for the composite, a small step up for manufacturing, and a small step back in services for February compared to January. January had made across the board improvements relative to December.
Sequential comparisons where data are lagged by one month and the calculations are made only off of hard data (not off of flash or preliminary data) show mixed economic conditions and unclear trends. EMU shows sequential strengthening in the composite as do France and Japan; Japan also shows persistent strengthening in manufacturing, as the yen has been dropping. And while there is a lot of weakening sequentially, there is no persistent weakening reported for 12-months to 6-months to 3-months.
Over three months, there's a split in what is reported with 12 of the 24 sectors weakening compared to six months ago and 12 of them strengthening. Over six months, only six of the sectors are weakening; the remainder strengthening over 12 months; eight of the sectors are weakening over 12 months compared to a year ago, with the remainder strengthening. While it's not a clear path to deterioration, there is a clear tendency to deterioration over three months compared to six months. However, an unweighted comparison of the three sectors shows that composite manufacturing and services still demonstrate a bit of muddy water with the composites weakening over three months only by a tick to 52.9 compared to 53 while manufacturing improves slightly and services weakens slightly compared to six months. Over six months, there's only a slight step back from the statistics reported over 12 months.
Not a lot of shifting, but some good news and bad news The bottom line is there's not a whole lot of change going on according to the PMI data. On a breadth basis, there has been some improvement, but the magnitudes involved seem to wash out some of that improvement, neutralizing when expressing as average comparisons. However, one place where there does appear to be evidence of more solid performance is in the queue percentile standings. Among these 8 reporters involving 24 sectors, only four sectors report current standings below their median on data back to January 2022. One of those countries is India, with a weaker composite and services sector; the other is the United States, with a weaker composite and services sector. The U.S. composite has a queue percentile standing at its 42nd percentile, below its neutral position of 50%. The U.S. services sector is even weaker with a 36-percentile standing, close to the lower third of all the U.S. PMI values that have shown for services since 2022 on a monthly basis.
U.S. economy has been cranking out some reasonably strong economic numbers across the board including consumer spending and GDP figures, allowing for a disappointing fourth quarter that is being attributed to the government shutdown. However, what's been lacking on the U.S. side has been strong job market performance and, of course, because of mortgage rates being high, there has been a weak construction sector in the U.S. economy. Still, the queue standing across the board for other countries should be reassuring. The average composite ranking for this group of countries is in the 70th percentile, with manufacturing in the 75th percentile and services in their 61st percentile. These are relatively firm readings and should be reassuring. At the same time, central banks have made progress on inflation and tightening cycles have not been engaged or easing cycles are being extended for all central banks except for the Bank of Japan, which has been experiencing growth and inflation in different measures from the rest of the G7 countries. On balance, however, global growth appears to be moving forward and now we'll have to see what happens with the U.S. Supreme Court having overthrown the imposition of tariffs that the Trump administration put in place without Congressional backing. We could see some considerable shifting in the months ahead.
 Global| Feb 19 2026
Charts of the Week: AI, Policy Easing and a Shifting Risk Premium
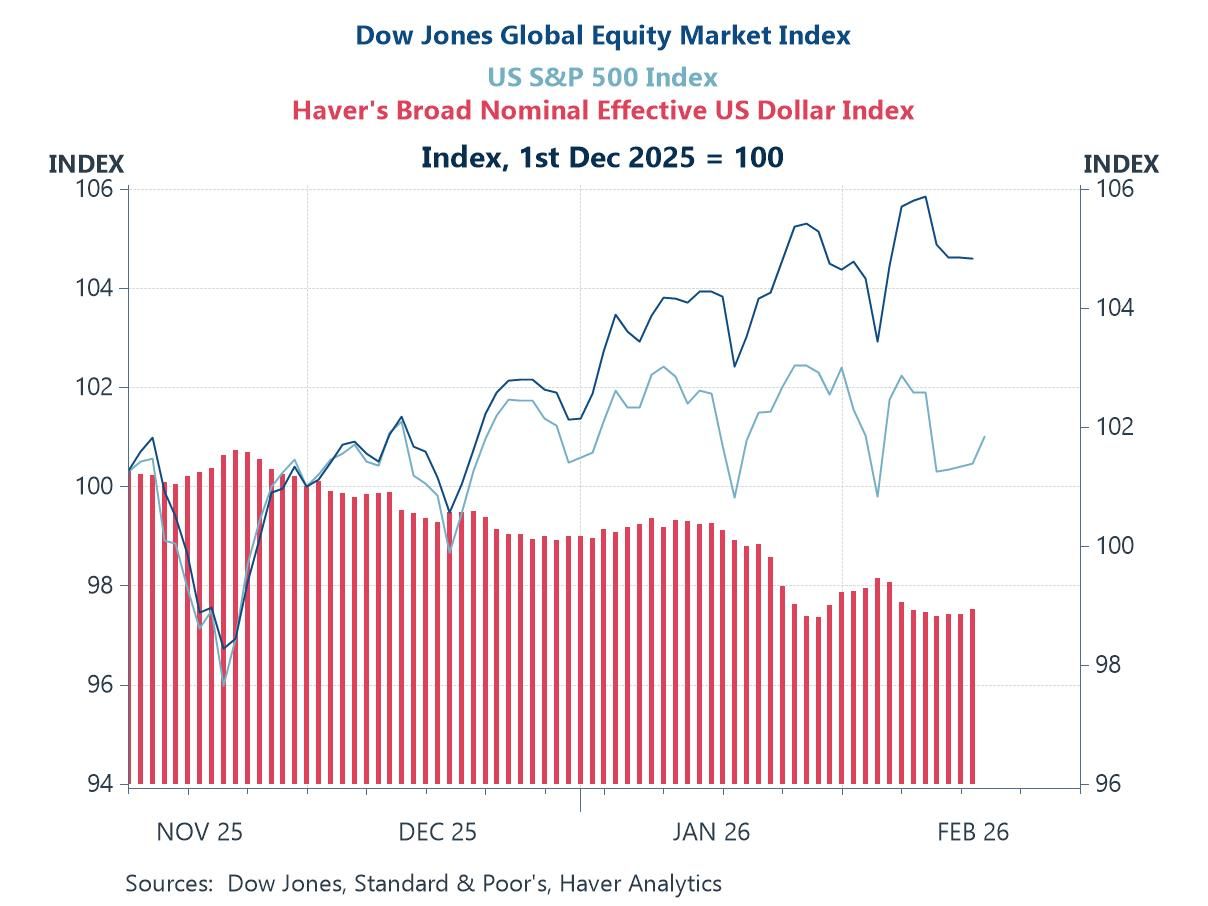
Recent weeks have seen renewed market swings — a softer US dollar, rotation within equities and shifting rate expectations — as investors reassess valuations, policy risks and the durability of US exceptionalism. Yet a consistent macro thread runs through our charts this week. Global equities continued to outperform the US, hinting at a modest rise in the US risk premium alongside AI-valuation concerns (chart 1). At the same time, firmer bank lending growth across major economies reflects looser monetary policy and arguably helps explain why risk assets remain broadly supported despite volatility (chart 2). On productivity, a US pickup is evident but likely reflects capital deepening from AI infrastructure rather than a decisive surge in total factor productivity (chart 3). Industrial production in advanced Asia reinforces where that build-out is concentrated — at the heart of the semiconductor supply chain (chart 4) — while strong US orders for computers and electronic products underline the intensity of domestic demand for high-tech and AI-related equipment (chart 5). Finally, renewed equity inflows into Emerging Asia show investors positioning around this AI-centric growth dynamic (chart 6). In short, easier policy and AI-driven investment are sustaining momentum — but the breadth and durability of the productivity dividend remain a key open question.
by:Andrew Cates
|in:Economy in Brief
 USA| Feb 19 2026
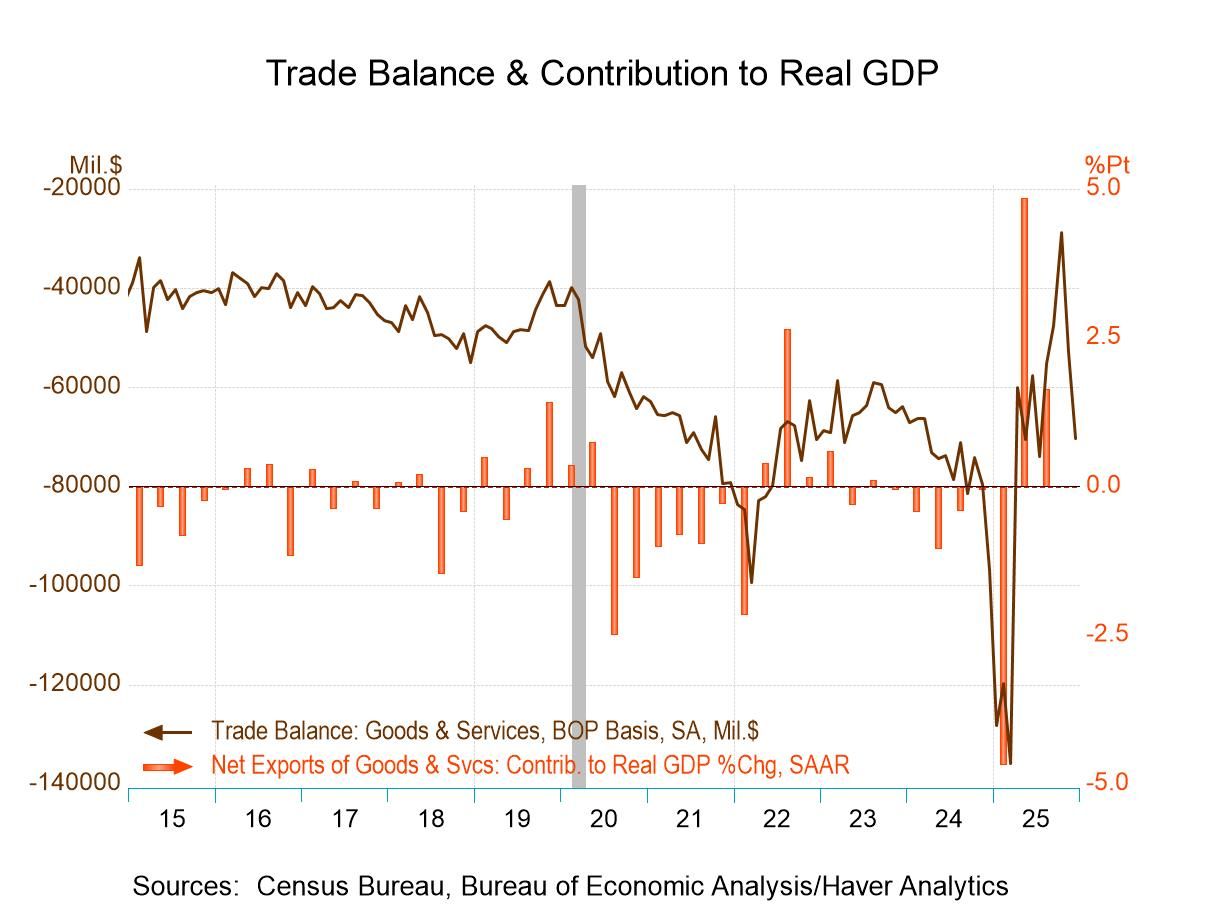
U.S. Trade Deficit Widened Much More Than Expected in December
- The overall deficit widened to $70.3 billion in December from $53.0 billion in November.
- The goods deficit widened markedly to $99.3 billion from $83.6 billion in November.
- The services surplus narrowed slightly to $29.0 billion from $30.6 billion in November.
- Exports fell 1.7% m/m on top of a 3.4% monthly decline in November while imports rose 3.6% m/m following a 4.2% gain in November.
- For all of Q4, the real goods trade balance narrowed, suggesting that trade contributed to overall GDP growth.
by:Sandy Batten
|in:Economy in Brief
- of2725Go to 29 page