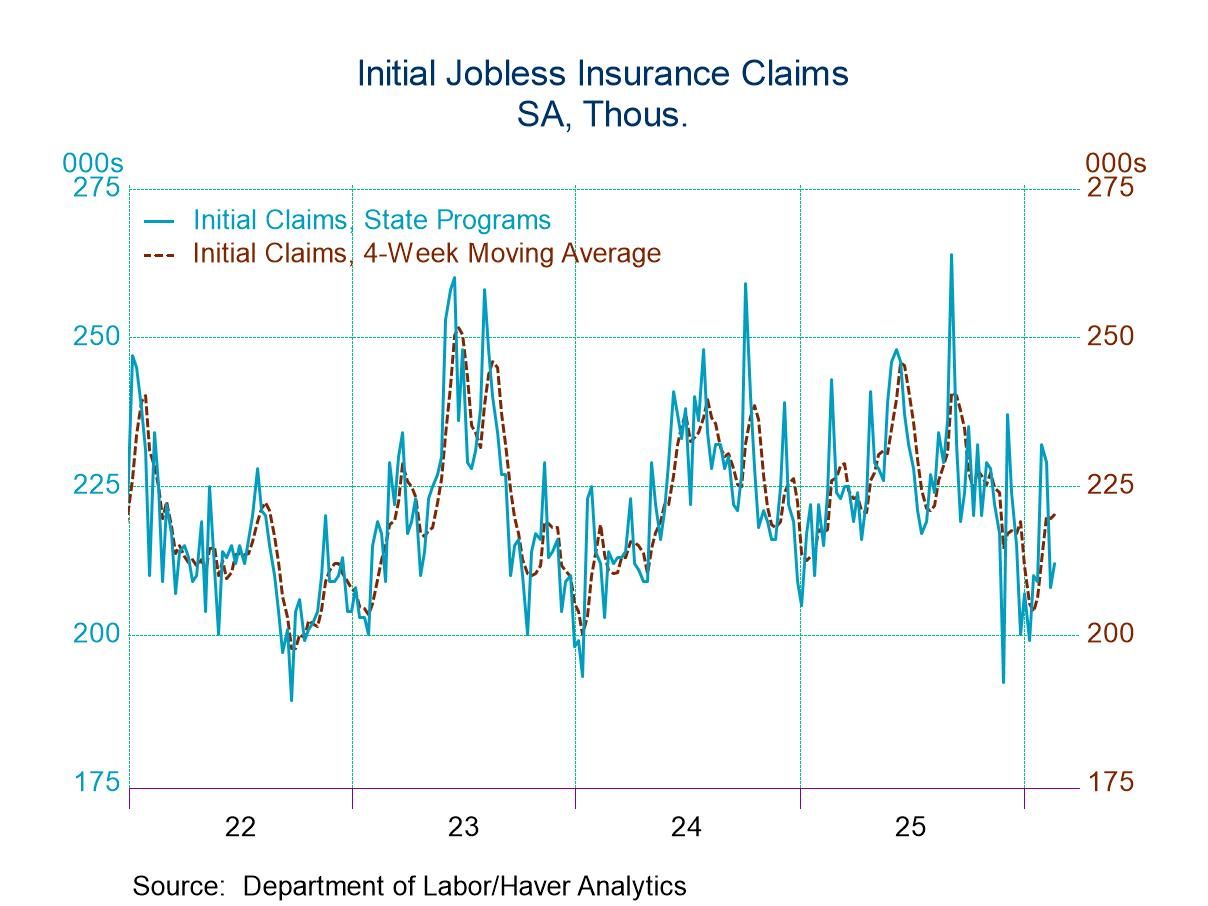
- New claims rose by 4,000 to 212,000.
- Continuing claims declined by 31,000 to 1.833 million.
- The insured unemployment rate remained at 1.2% for the 12th consecutive week.
 USA| Feb 26 2026
U.S. Initial Unemployment Claims Rose in Latest Week
 Europe| Feb 26 2026
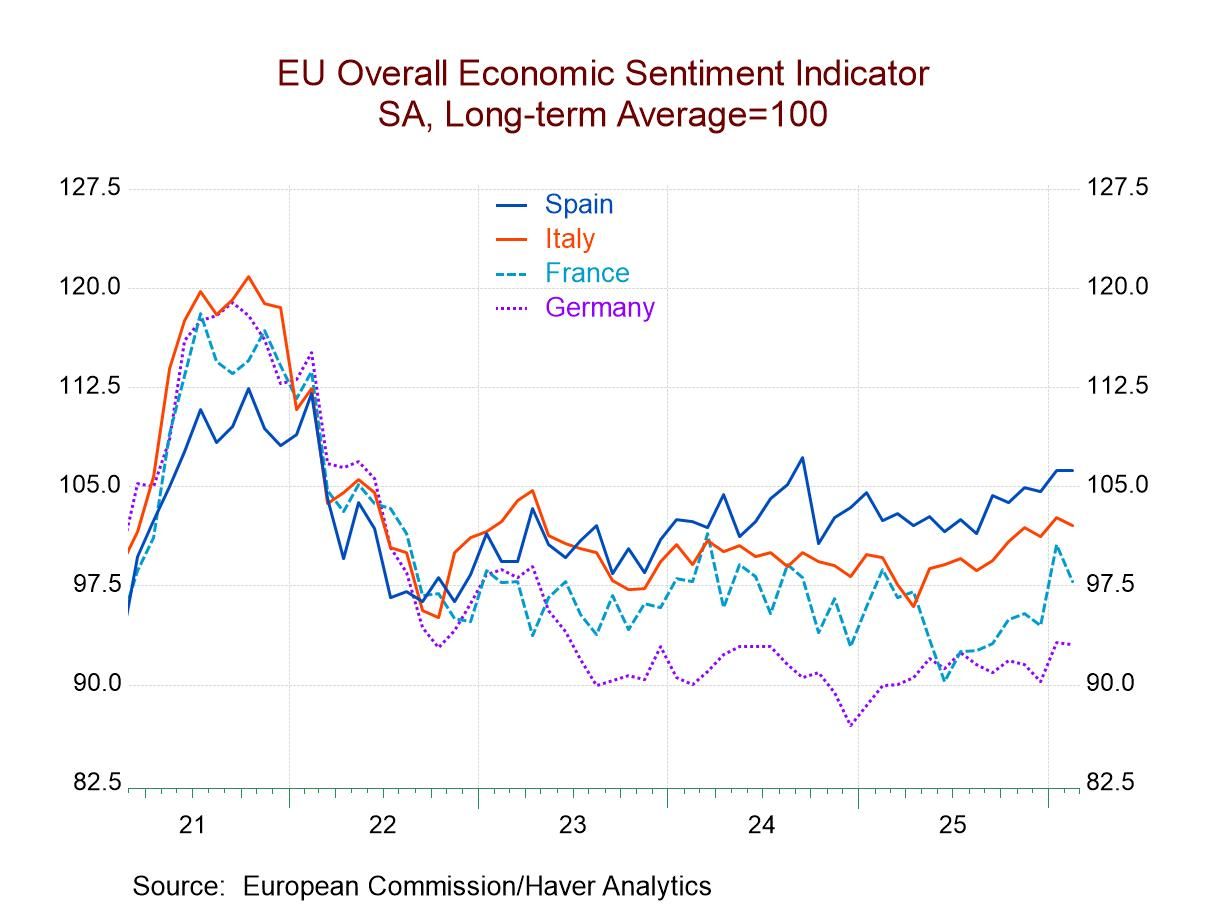
EMU Indexes Back Off But Hold Uptrend
EU Commission indexes that assess economic performance for the countries in Europe and in the European Monetary Union slipped in February to 98.3 from 99.3 in January; however, the February reading is still relatively strong by recent standards and leaves the index largely in an uptrend.
The February readings saw the industrial sector unchanged, a small upward move in consumer confidence, and a one-point backtracking in construction, as retailing improved by a point. The services sector index stepped back by two points, putting it back at its December level.
Ranking standings for economic groups The key ranking of the sectors in February show only two of the sectors with readings above their medians (i.e., above a ranking of 50%). Those sectors are retailing with a queue standing in its 60.4 percentile and construction with its queue standing in its 79.3 percentile. Consumer confidence continues to be the weakest with a 27.8 percentile ranking, services check in with a 33.4 percentile ranking, and the industrial sector has moved up to a 43.6 percentile ranking. However, the overall monetary union ranking is only in its 41st percentile, substantially below its historic median which resides at a standing at the 50-percentile mark.
Country level performance Beyond the sectors, there are 18 of the 20 monetary union countries that provide early readings to this survey. Eleven countries showed weakened performance in February compared to January. In January, seven countries had weakened relative to December. In December, seven countries had weakened relative to November. However, in December, four of the countries that weakened were the four largest economies in the monetary union. In January, none of the largest four economies weakened month-to-month. Now, in February, we have three of the four largest economies weakening month-to-month, with the other one, Spain, posting an unchanged reading. The large countries in the monetary union have begun to have a little more difficulty over these last three months.
Standings by country Percentile-standing data showed that, of the 18 countries in the table, only 8 have readings that place them above their historic medians on data back to the mid-1980s. The large countries have split performance, with Italy reporting a 59.8 percentile standing and Spain reporting a 72.4 percentile spending, while the two largest monetary union economies, Germany and France, post readings in the 23rd percentile for Germany and the 44th percentile for France. The ranking for the monetary union as a whole is at its 41st percentile. That compares to an unweighted average ranking in the 44th percentile for all the countries when their individual rankings pooled and averaged. The two ratings are close together.
Apart from the Big Four Among the rest of the monetary union members, countries with readings above the 50th percentile are Malta, Greece, Lithuania, Latvia, the Netherlands, and Cyprus. Four countries vie for having the weakest reading in the table, with readings in their 20th percentile region. That list includes Big Four member Germany with the 23.5 percentile standing, Slovakia with a 23.8 percentile standing, Belgium with a 23.1 percentile standing, and Austria with a 22.1 percentile standing. There is considerable heterogeneity among the rankings of the monetary union member countries across all size classes. In addition, as we saw above, looking at the sectors, the sector rankings varied from a low of 27th percentile standing for consumer confidence to a high of 79th percentile standing for construction.
 USA| Feb 25 2026
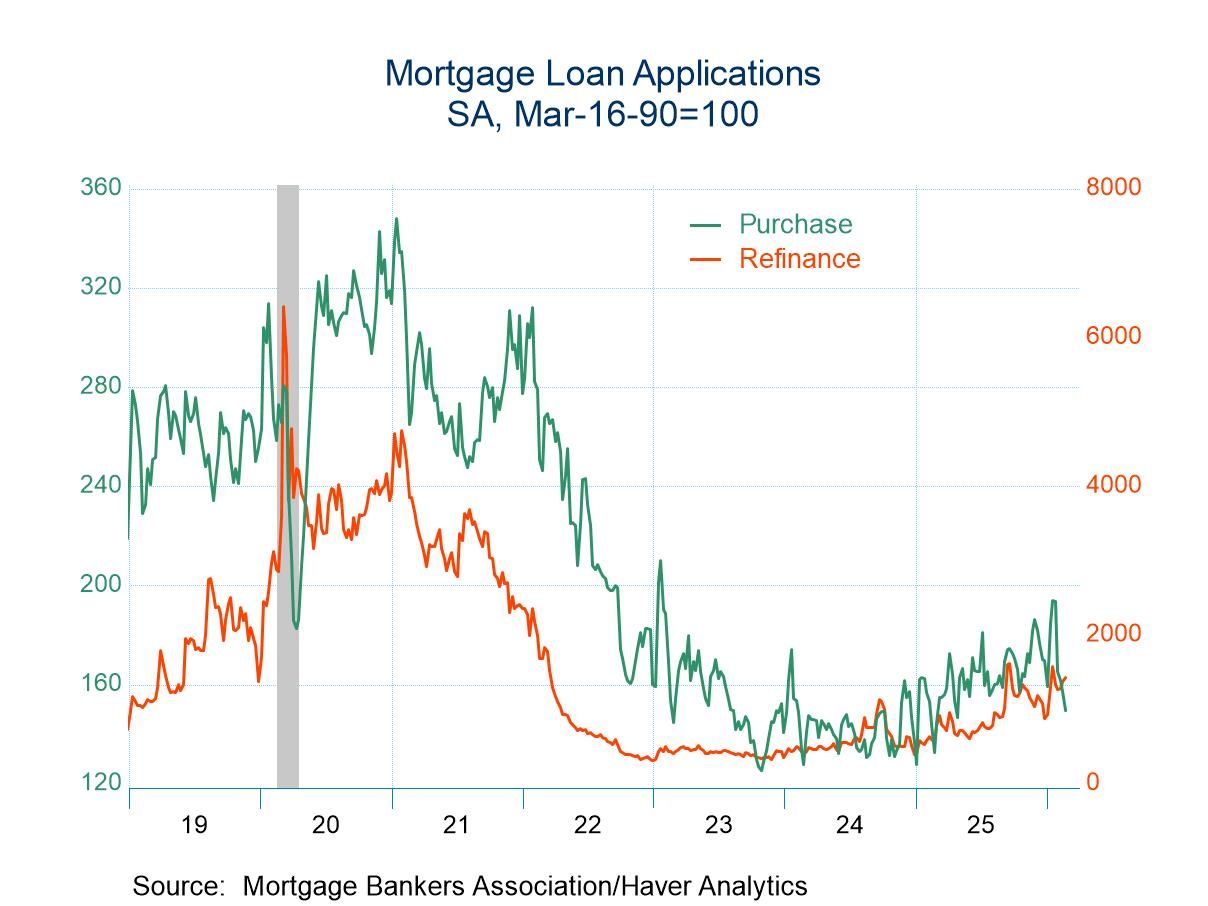
U.S. Mortgage Applications Edged Up in the February 20
- Applications for loans to purchase declined in the latest week while refinancing loan applications rose.
- Effective interest rate on 30-year fixed loans declined 9bp to 6.24%.
- Average loan size edged up.
 Germany| Feb 25 2026
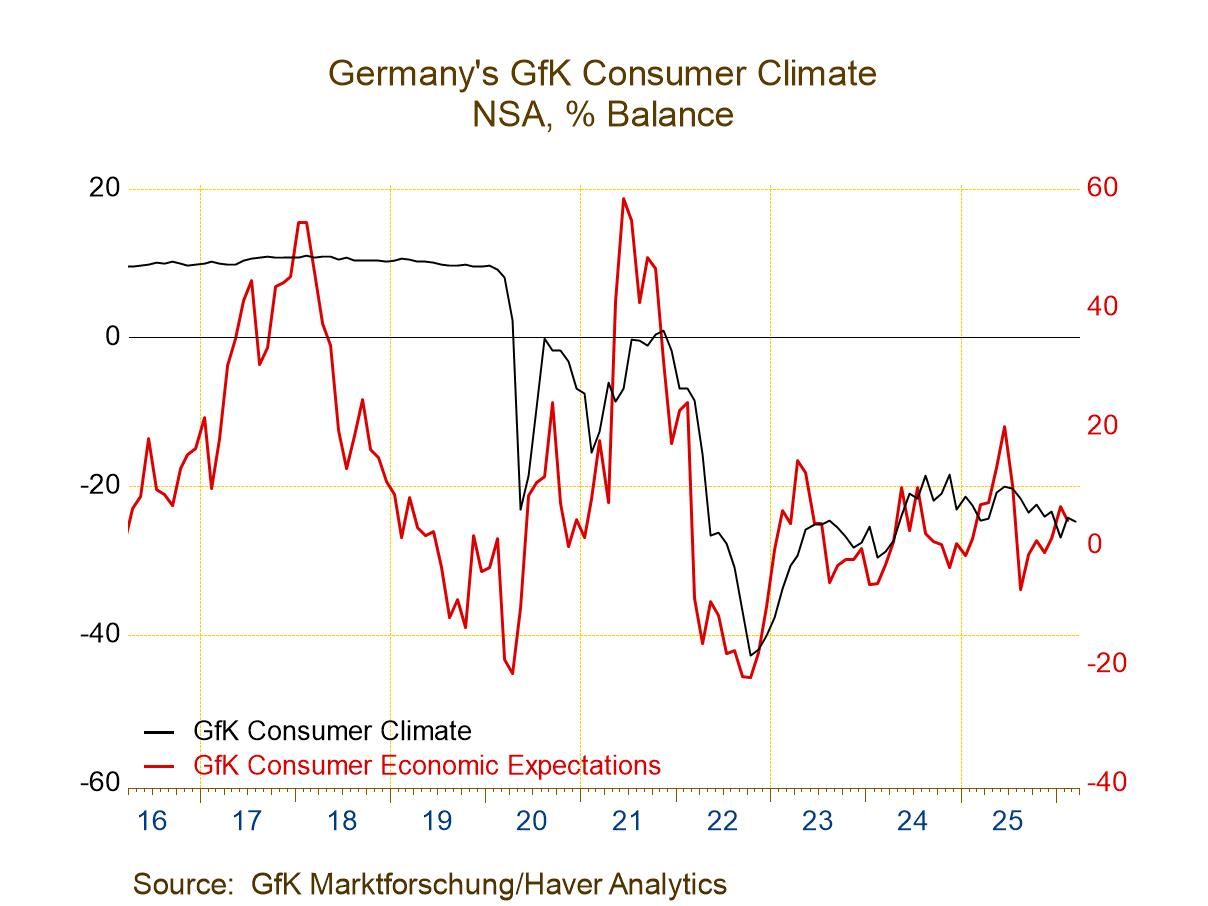
German Confidence: GfK Consumer Climate Erodes
Climate eased in March after improving in February. There still is a net improvement compared to January, but we must turn the calendar back to April 2024 to find a climate reading lower than the current level in March. In sum, there is no sense of ongoing improvement for climate in this report. The economic expectations and income expectations readings, which lag by one month, do show some improvement on a longer timeline. But the propensity-to-buy index is still quite weak.
Climate at -24.7 in March has an 8.2 percentile standing on data back to 2002. The economic expectations, reading, fell back to 4.3 in February from 6.6 in January to set a 49-percentile standing. Income expectations rose to 6.3 in February from 5.1 in January. Income expectations have a 42.4 percentile standing. The propensity to buy weakened sharply to -9.3 in February from -4 in January. Its percentile standing is at a 30.7 percentile level, a bottom one-third standing.
The table also presents consumer confidence readings for three other European economies. Among them, Italy has the strongest ranking at a 74-percentiel standing. The Italian reading is up-to-date through January and has been showing improvement. The United Kingdom and France have similar standings. The U.K. standing is at its 43.7 percentile mark, below its median on this timeline. The U.K. reading is up-to-date through January and has been showing a tendency to improve. France has a rank standing at a 39.7 percentile; it is up-to-date through February. The index has been very slowly improving.
 USA| Feb 24 2026
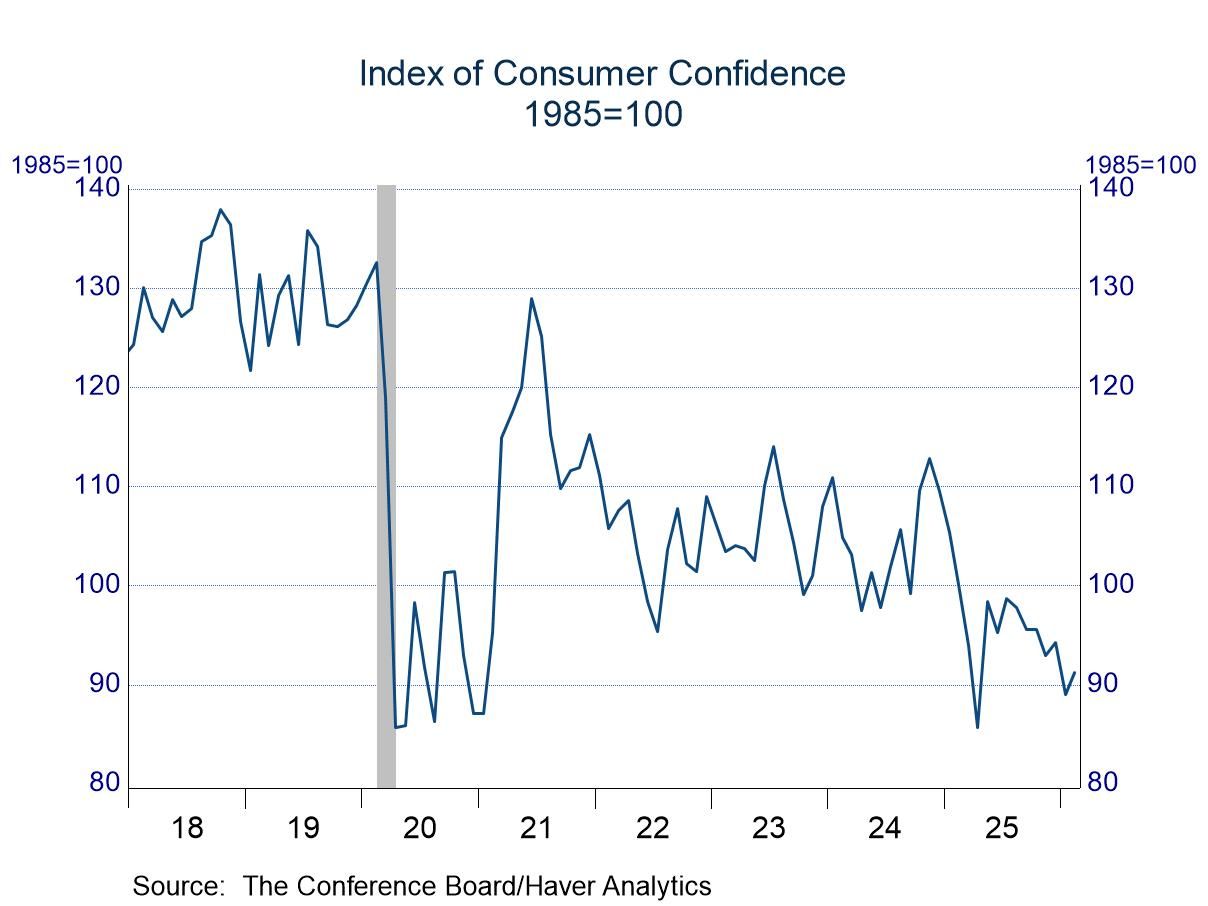
Consumer Confidence: Improvement in February from Upward Revised Levels in January, but Individuals Are Still Unhappy
- Firmer expectations offset dimmer views on the present situation.
- Although views on the present situation dipped, assessments of the labor market picked up.
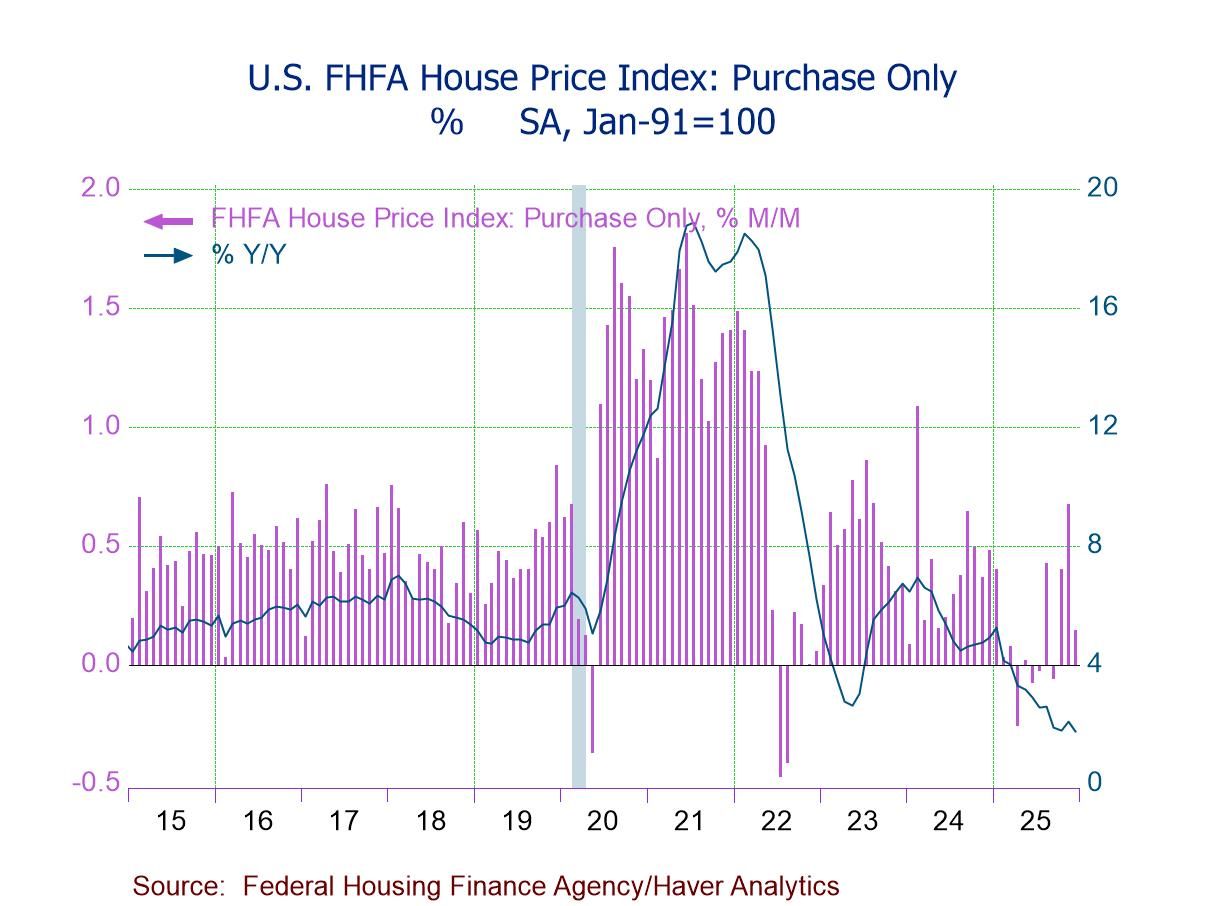
- FHFA HPI +0.1% (+1.8% y/y) in Dec., the smallest of three straight m/m gains.
- House prices up m/m in six of nine census divisions, led by Middle Atlantic (+1.1%), but down in West South Central (-1.0%) and East South Central (-0.1%); prices flat m/m in Pacific.
- House prices up y/y in six of nine regions, led by East North Central (+5.2%), but down in Mountain (-0.6%), Pacific (-0.4%), and South Atlantic (-0.1%).
- House price growth accelerates to 0.8% q/q (+1.8% y/y) in Q4'25 from 0.3% q/q (+2.4% y/y) in Q3.
 France| Feb 24 2026
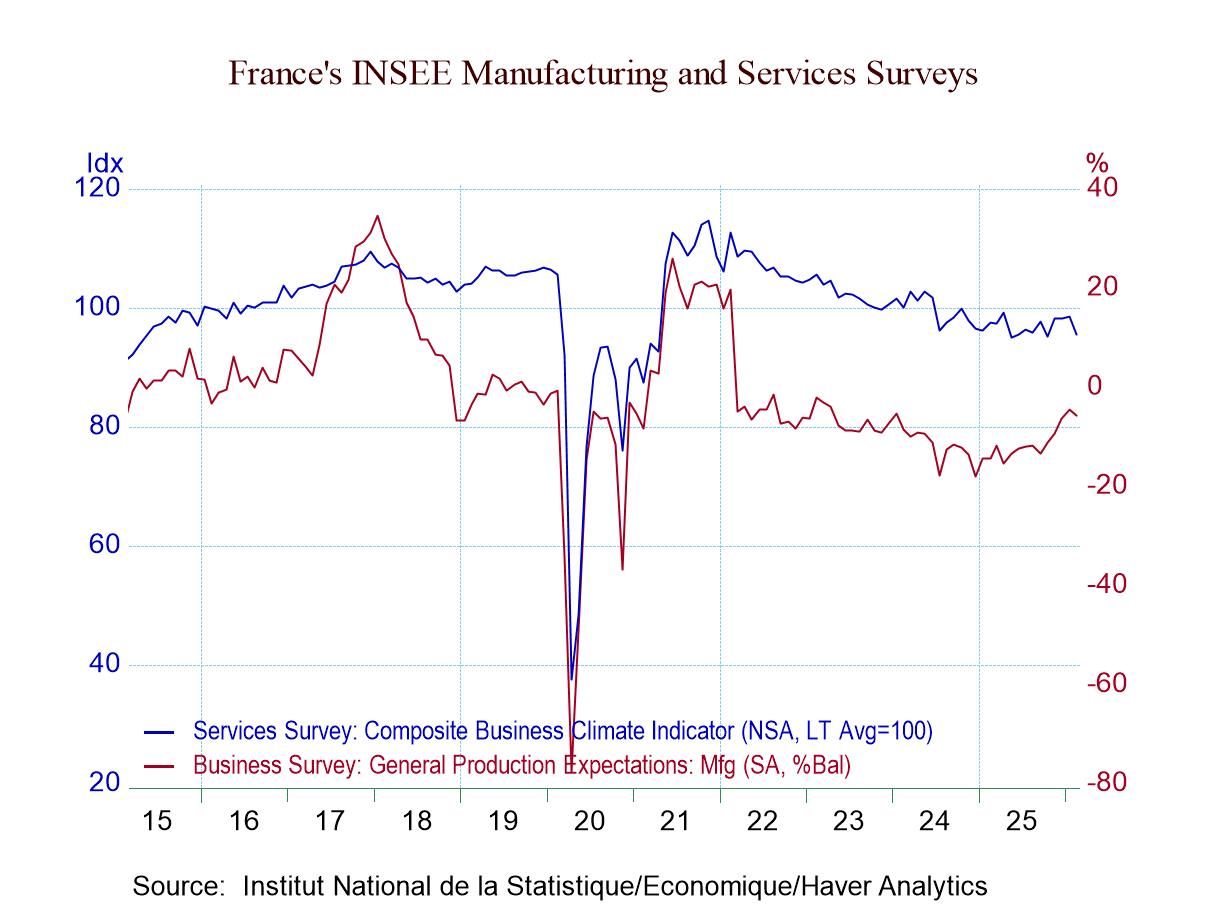
French Manufacturing and Services Surveys: Two Sectors, Two Different Trends, and Lingering Weakness
Neither the service sector nor the manufacturing survey value is particularly strong. The services climate headline has a 25-percentile standing; it has been higher about 75% of the time. That is not a good result. For manufacturing and industry, the standing is just short of the 50% mark which leaves it quite close to its historic median. That is not strong, but it is not weak either; it’s a modest middle ground. But February’s reading gave up ground, falling to 102.1 from 105.4 in January, back essentially to its December 2025 level. Even so, the February value has not been exceeded persistently until we go back to August 2022—three and one-half years ago.
The rebound in manufacturing is nascent; we can question its sustainability. And it is also only a modest step up after February’s erosion. Orders and demand flared higher in January and backed down in February. Orders and demand have a 50-percentile standing, with foreign orders much stronger at a 75-percentile standing. While production has a sub-median, 42-percentile standing, responses, when aggregated, show an ‘own-personal’ response standing at 62.2%. Maybe there is more granular, industry-level confidence that is being restrained by macroeconomic pessimism. This two-tier response is recreated compatibly for prices where firms see high own price trends stronger than their whole-economy trend. The own-price trends are elevated with a ranking over their 60th percentile while the macro price expectation is at a 48-percentiel standing. Production expectations are a classical representation of this month’s survey, falling back this month after some improvement last month and sporting a 49.1 percentile standing – a near median result. The manufacturing survey does not suggest any trouble; it exhibits near normal behavior, with orders at a midstream level/ranking.
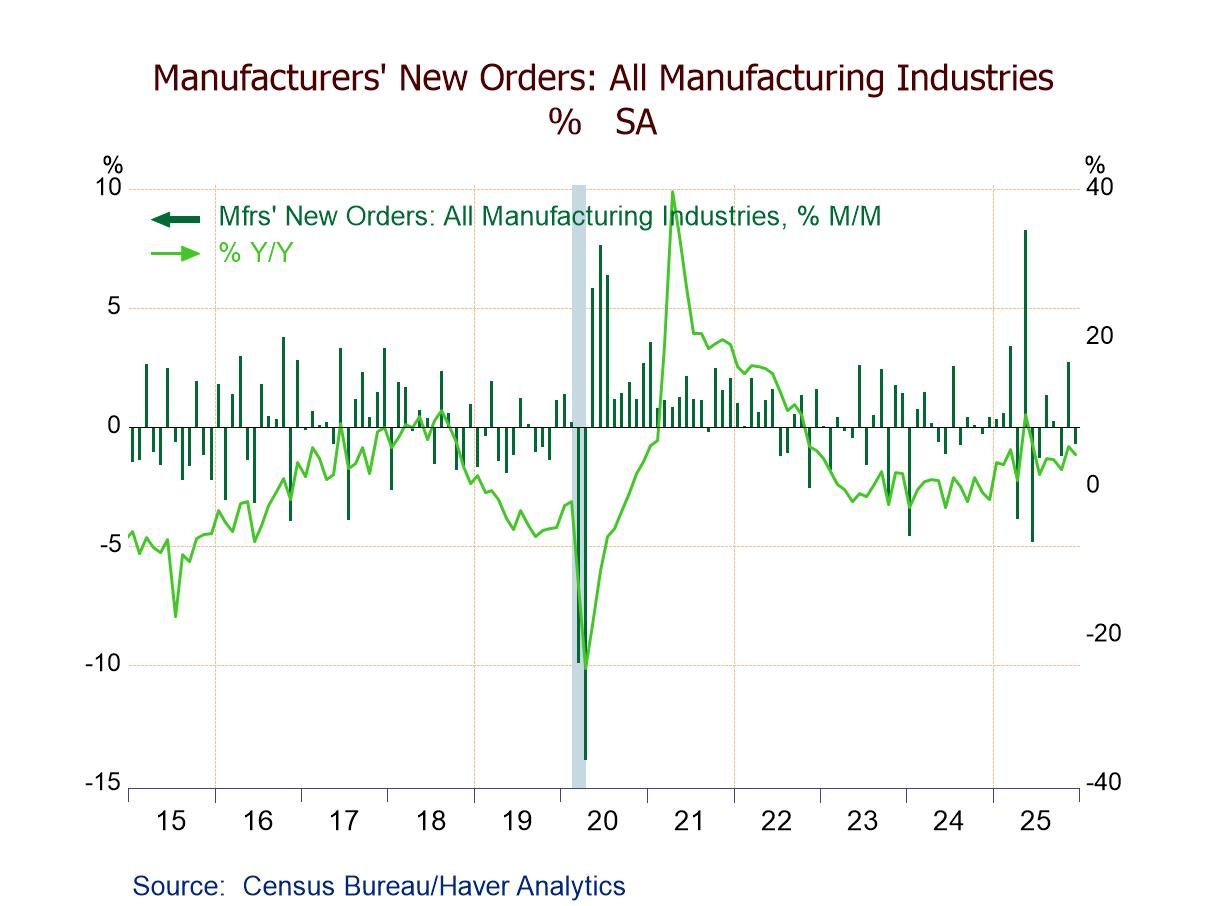
- December factory orders -0.7% m/m (+4.3% y/y); still 7.2% above the Jan. ’24 low.
- Durable goods -1.4% m/m; nondurable goods orders flat; shipments +0.5% m/m.
- Transportation orders -5.4% m/m, led by a 24.8% plunge in nondefense aircraft orders.
- Unfilled orders +0.9%, the fifth straight m/m rise.
- Inventories +0.1%, the second consecutive m/m increase.
- of2725Go to 28 page