- Growth is broadened, notably in capital spending, housing & government.
- Profit gain accompanies dividend decline.
- Strength in consumer spending is reduced.
- Increase in price index remains double Q2’s gain.

by:Tom Moeller
|in:Economy in Brief
 USA| Nov 29 2023
U.S. Advance Trade Deficit Widens Moderately in October
- Exports decline while imports were flat.
- Sizable reductions in exports of consumer goods, autos and “other” goods.
- Imports of capital goods up noticeably while autos and consumer goods decreased.

- Applications for loans to purchase provided support for overall mortgage applications in the November 24 week.
- Effective interest rates fell in the latest week except for rates on the 30-year Jumbo loans.
- The average size of mortgage loans rose.
 Europe| Nov 29 2023
EU Commission Indexes Show Slight Uptick
The EU Commission survey for the EMU and its members ticked up to 93.8 in November from 93.5 in October. Still, the overall index has a queue ranking on data back to November 1990 in its 26th percentile. The five component indexes for November showed an improvement in consumer confidence and in construction against a deterioration in the industrial gauge and unchanged month-to-month readings for retail and services.
In terms of standing, the construction sector in the EMU has a solid 72.8 percentile standing while retailing has held at a 55.4 percentile standing; both are above historic medians. However, the industrial sector ranks in its 26.7 percentile, with services in their 40.4 percentile and consumer confidence even weaker at its 17.9 percentile - all three are below their respective historic medians.
All five sectors plus the headline continue to reside below their pre-COVID levels of January 2020, a period of nearly four years. The EMU gauge has been below its January 2020 level 72% of the time. Only the industrial sector has been below its January reading less, only about one-third of the time. All other components have been below their January 2020 levels more than 75% of the time over the past nearly four years.
 USA| Nov 28 2023
U.S. Consumer Confidence Improves in November Following Three Straight Months of Decline
- Business, employment & income expectations improve.
- Current conditions index dips.
- Inflation expectations decline.
by:Tom Moeller
|in:Economy in Brief
 USA| Nov 28 2023
U.S. FHFA House Prices Continue to Appreciate in September
- FHFA HPI +0.6% m/m in Sept.; +6.1% y/y, the highest y/y rate since Dec.’22.
- House prices rise m/m in eight of nine census divisions vs. a 0.4% drop in the Pacific region.
- House prices gain y/y in all of the nine regions, w/ the highest rate in New England (11.4%).
 USA| Nov 28 2023
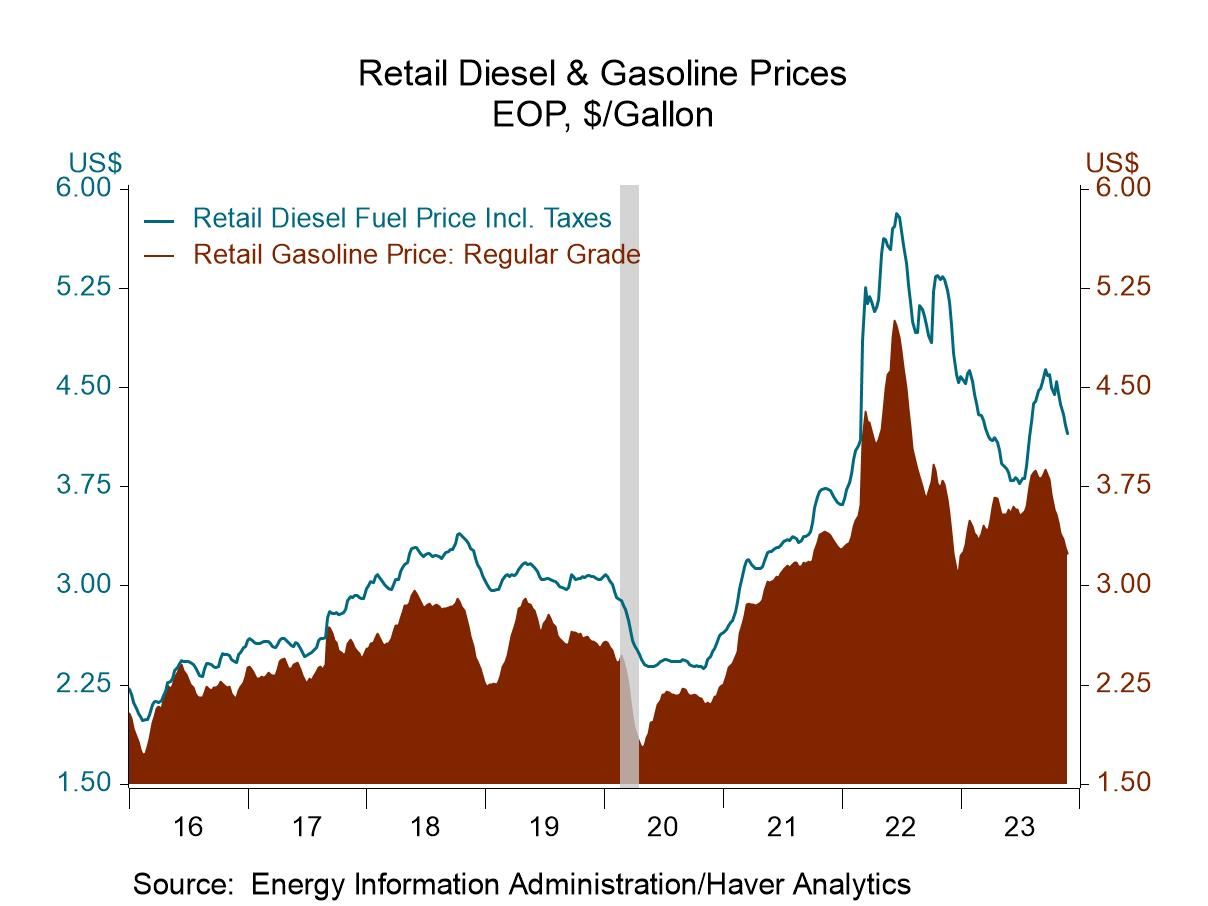
U.S. Energy Prices Are Mixed
- Gasoline & diesel fuel prices continue to fall.
- Crude oil prices edge higher.
- Natural gas prices decline.
by:Tom Moeller
|in:Economy in Brief
 Germany| Nov 28 2023
German Confidence Makes a Minor Rebound, Hovering at Its Third Lowest Reading in Nine Months
The German consumer climate gauge for December 2023 improved slightly to -27.8 from -28.3 in November. Apart from the November reading, the climate reading in December was last weaker in April 2023. From August 2022 to April 2023, climate marked a period in which GfK reading was persistently weaker than it is today, in December. However, apart from this nine-month interval, and the reading for November, there are no other climate readings lower than the current December reading from GfK at any time in the past.
The climate reading for December has a 3.8 percentile standing, which tells us that it has been this week or weaker less than 4% of the time.
Weak components and their momentum The components of the climate reading consist of economic and income expectations, and a propensity to buy measure. These components are available with a one-month lag. In November, the economic expectations indicator improved slightly, rising to -2.3 from October’s -2.4. This continued a string of improvements for economic expectations. Income expectations in November, however, slipped to -16.7 from -15.3 that extended a two-month ongoing decline in that indicator. The propensity to buy in November improved slightly to -15 from -16.3; it has been improving very slightly but consistently in recent months.
Low-ranking component values The ranking of these components remains quite weak. Economic expectations have a queue-standing at their 32.7 percentile in the bottom one-third of their historic queue of readings. Income expectations are much weaker with an 8.7 percentile standing of their queue of data, marking income as in the lower 10% of all readings. The propensity to buy has a 22.4 percentile standing, in the bottom 25th percentile of its historic queue of data. All of these are very weak readings. And while they trail the current December reading for climate in terms of topicality, it's quite clear that the climate ranking is much lower than any of these components and what that tells us is that it's the confluence of weakness among all the components topically that is unusual and is substantially responsible for the extremely weak reading for climate.
The German economy The Bundesbank continues to look for declines in the Germany economy. The current government has just had a setback in which some of its plans to engaging green spending have been flagged by the courts as inconsistent with their budgetary process and therefore monies that they thought they had set aside for their economic agenda are now going to count towards the budget deficit which will cause the administration to have to scramble and reorganize priorities and spending. At the same time, the war between Russia and Ukraine just continues to drag on mercilessly. While it appears that Ukraine is persisting and possibly even making gains against Russia, as Russia is losing huge numbers of troops due to ham handed strategies, the outcome of the war hangs in the balance and Ukraine's dependence on continued arms provision and the aid from its allies remains as important as ever at a time where some of these allies are beginning to engage in grumbling about how expensive it has been to finance this war and how slow the progress now is going.
Consumer confidence elsewhere in Europe We can compare the GfK climate figures to consumer confidence for other European countries. France and the U.K. have the most up-to-date readings, with consumer readings that are available through November, only one month behind the GfK reading. In France, the INSEE measure has moved up in November to a 25.9 percentile standing. In the U.K., consumer confidence has moved up to -24 in November from the level of -30 in October, to a standing at its 27.8 percentile. Readings for confidence in Italy lag and are available only through October. Italian confidence has been easing from August to September to October; that leaves the October reading at 101.6 down from 105.4 in September; still, it has a 57.1 percentile standing. Italy has the strongest standing for consumer confidence among this group of countries, but the U.K. and France have similar weak rankings, and Germany comes in with the weakest readings of all, but with component standings more in line with those of overall confidence readings that we see from France and the U.K.
- of2727Go to 268 page