

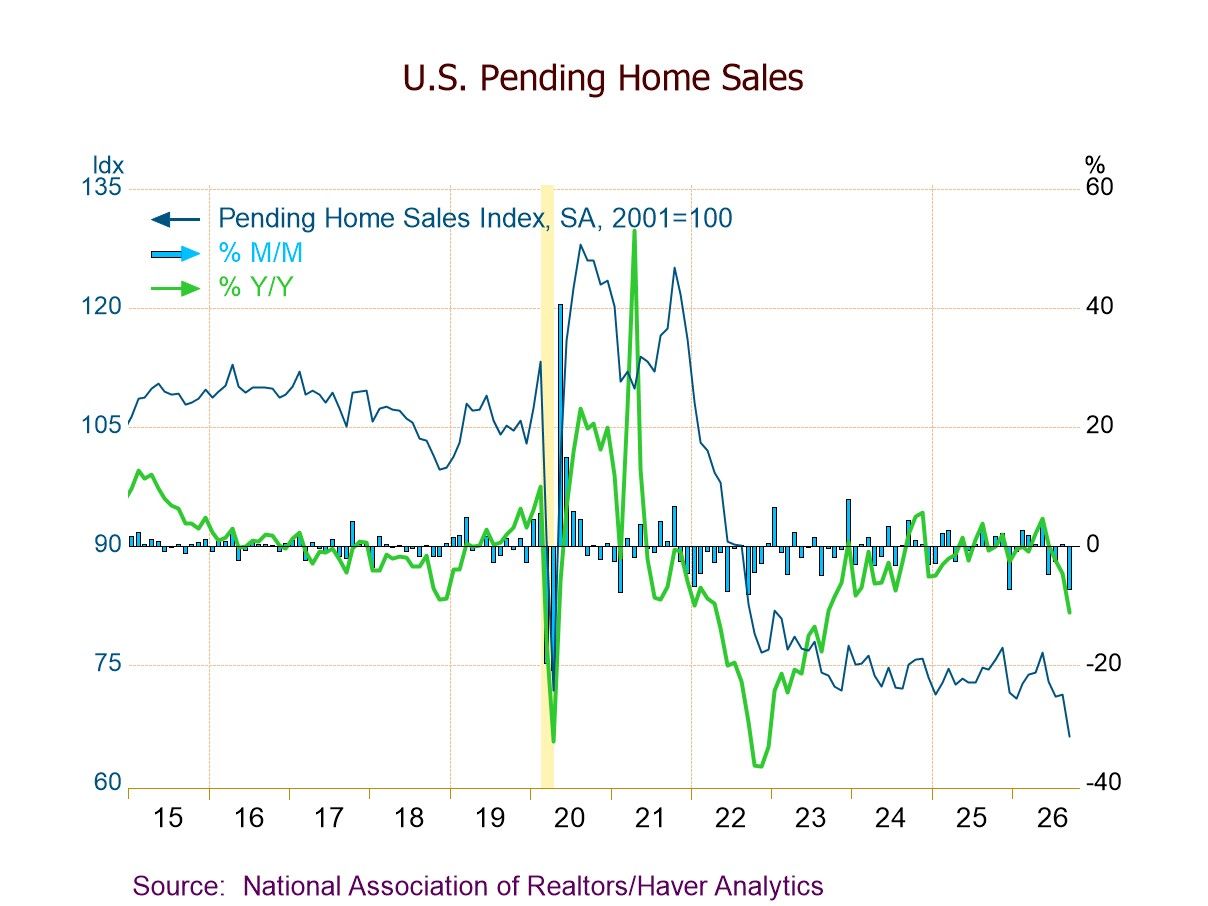
- PHSI -7.3% m/m (-11.3% y/y) to an all-time index low of 66.0 in Sept; third decline in four mths.
- Home sales down m/m and y/y in all four regions, w/ the steepest drop in the West (-9.2% m/m, -15.0% y/y).
- 30-year mortgage rate up to 6.86% in Sept., highest since Jan. ’25, weighing on homebuying demand and affordability.
 USA| Oct 20 2026
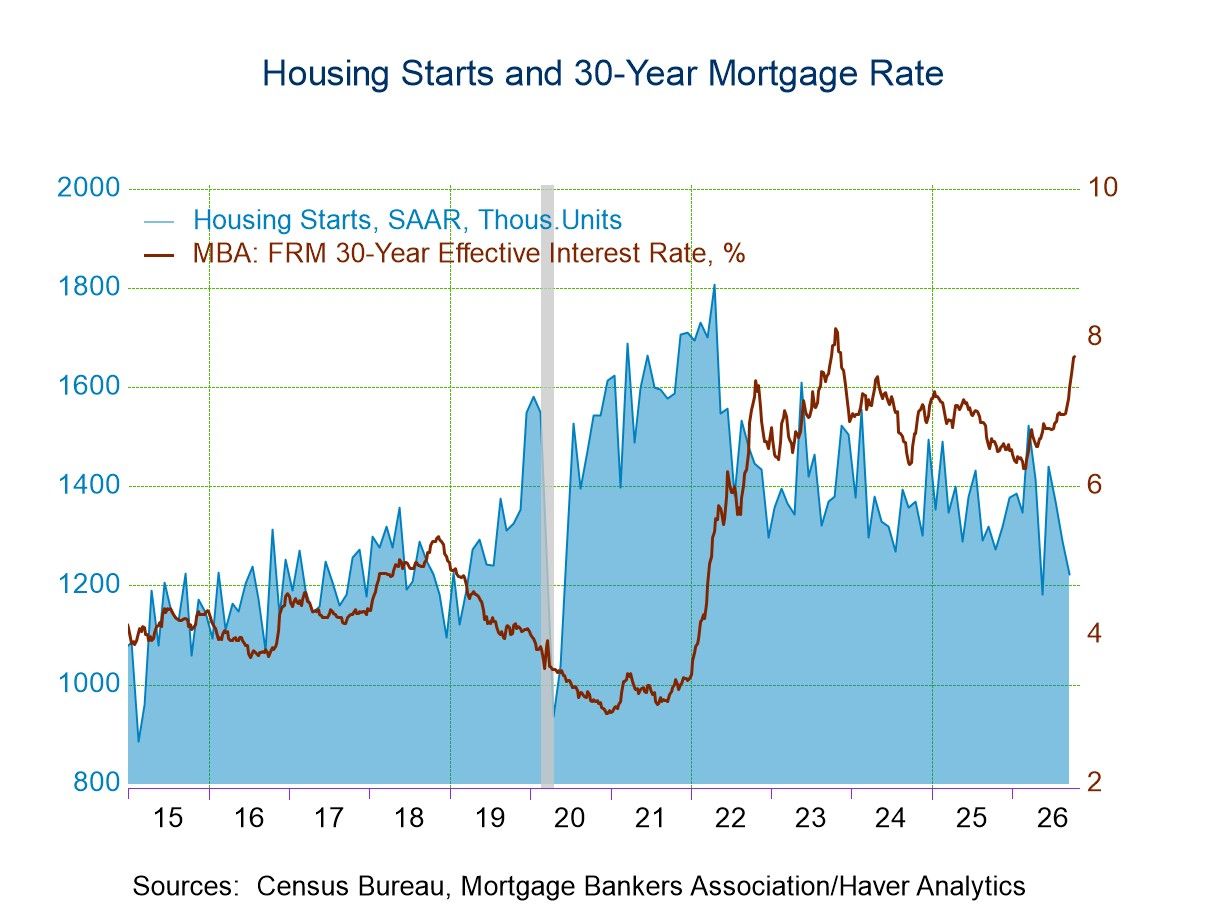
September U.S. Housing Starts Hit by Rising Interest Rates
- Housing starts fell 5.2% m/m in September to their second lowest level since the COVID pandemic shutdown with upward revisions to both July and August.
- Both single-family and multi-family starts declined in September.
- Permits were little changed in September with a sharp rise in muti-family permits nearly offsetting a meaningful decline in single-family permits.
by:Sandy Batten
|in:Economy in Brief
 Global| Oct 20 2026
ZEW Survey Shows a Sharp Reduction in Inflation Concerns
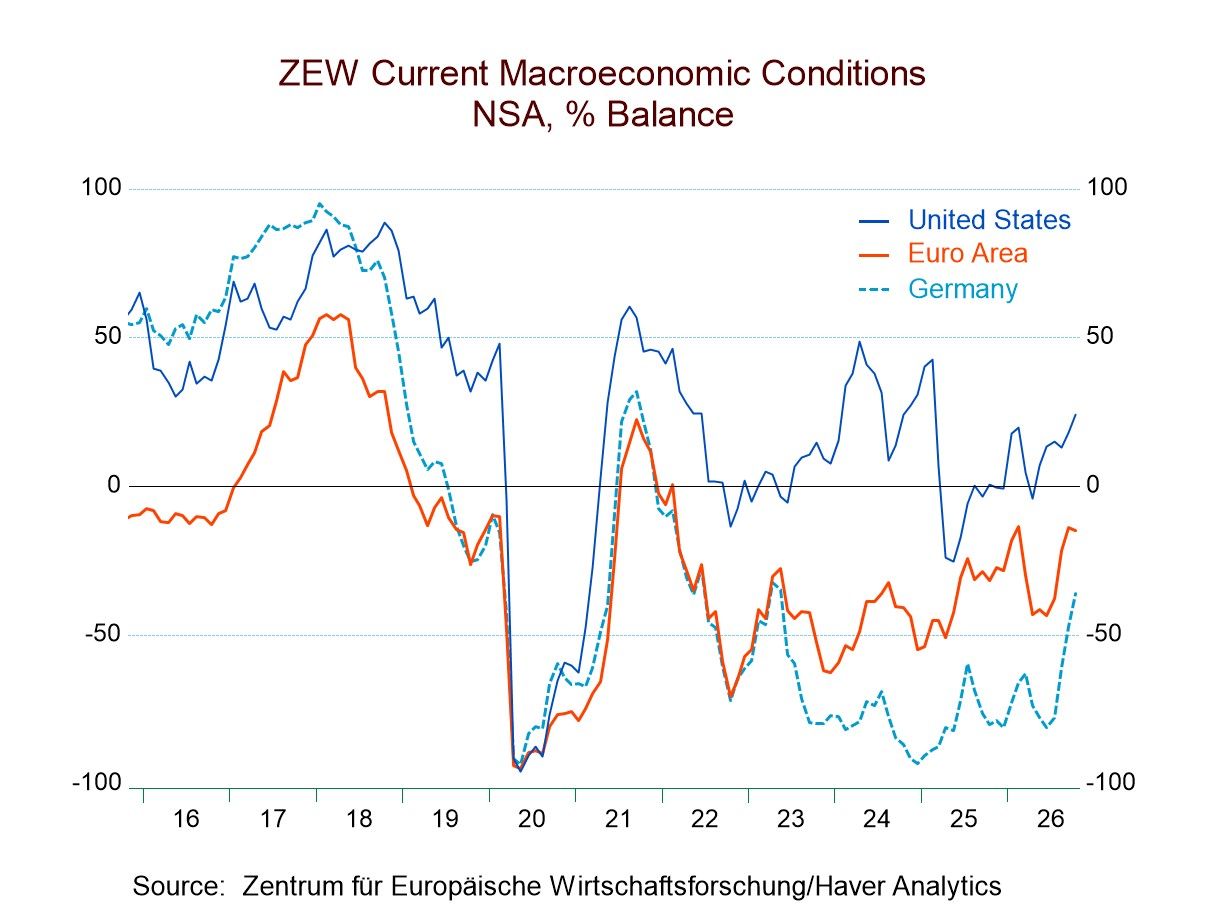
The current situation assessment is mixed To the ZEW experts, economic assessments of the current situation in October are split, with slight deterioration reported for the euro area as a whole and a two-point step-back for China. However, for Germany and the United States, there were significant improvements with the month-to-month diffusion indexes improving by 6 points in the U.S. and by 11 points in Germany. Ironically, both of the weakening areas, the euro area and China, have percentile standings above their historic medians, with China at a 76.1 percentile standing and the euro area at a 58.7 percentile standing. Germany and the U.S. show some strengthening month-to-month, but their standings are still below their historic medians. The German standing is at a 42.5 percentile and the U.S. standing is at a 46.2 percentile.
Economic expectations ease broadly Economic expectations, however, are unequivocally weaker across the reporting countries. There were declines in expectations in Germany of 6.6 points, in the U.S. of 5.3 points, and in China of 4.2 points; each of these three reporters shows a measurable slippage in October. Among the three countries showing slippage, only Germany continues to report economic expectations ranking above its historic median, at a standing of its 53rd percentile (a ranking above 50 means above median).
Inflation makes a sharp step back The real story of the ZEW survey this month, however, is on inflation where the inflation expectations dropped sharply across the board. For the euro area, expectations dropped 26 diffusion points; in Germany, they dropped 24 diffusion points; in the U.S., they dropped 22 diffusion points; and in China, they dropped by 15 diffusion points. Inflation expectations are above their median now only in China, with a 62nd percentile standing. In the U.S., inflation expectations have dropped to a 28th percentile standing.
Rising short-term rates continue as inflation is expected to abate With the decline in inflation expectations, however, short-term interest rate expectations rose by 2 points in the euro area and by 5.2 points in the United States, while in China there was a step-back of 4.1 diffusion points. All three areas, however, have short-term rate expectations well above the historic median levels.
Low inflation expectations boost bond values The reduction in inflation expectations has had the biggest impact on long-term interest rate expectations. Those have fallen in Germany by 13.2 diffusion points; they've fallen in the U.S. by 18.3 diffusion points; and they've fallen in China by 5.0 diffusion points. The ZEW experts apparently think that central banks are going to continue to raise interest rates and the impact is going to be to flatten yield curves globally.
ZEW experts’ outlook for stocks The final market expectation of the ZEW experts is that stock markets generally are seen improving in this environment. For the euro area, there's a 4.1-point improvement; for Germany, a 5.8-point improvement; and for China, the diffusion index is 4.9 points higher. Only the U.S. has a slightly weaker outlook as the outlook falls by 2.3 diffusion points. All the stock market expectations are above their historic medians, generally ranging between readings above 50, at the 54th percentile to the 57th percentile, except for China, where the stock market expectation is in its 83rd percentile, extremely strong.
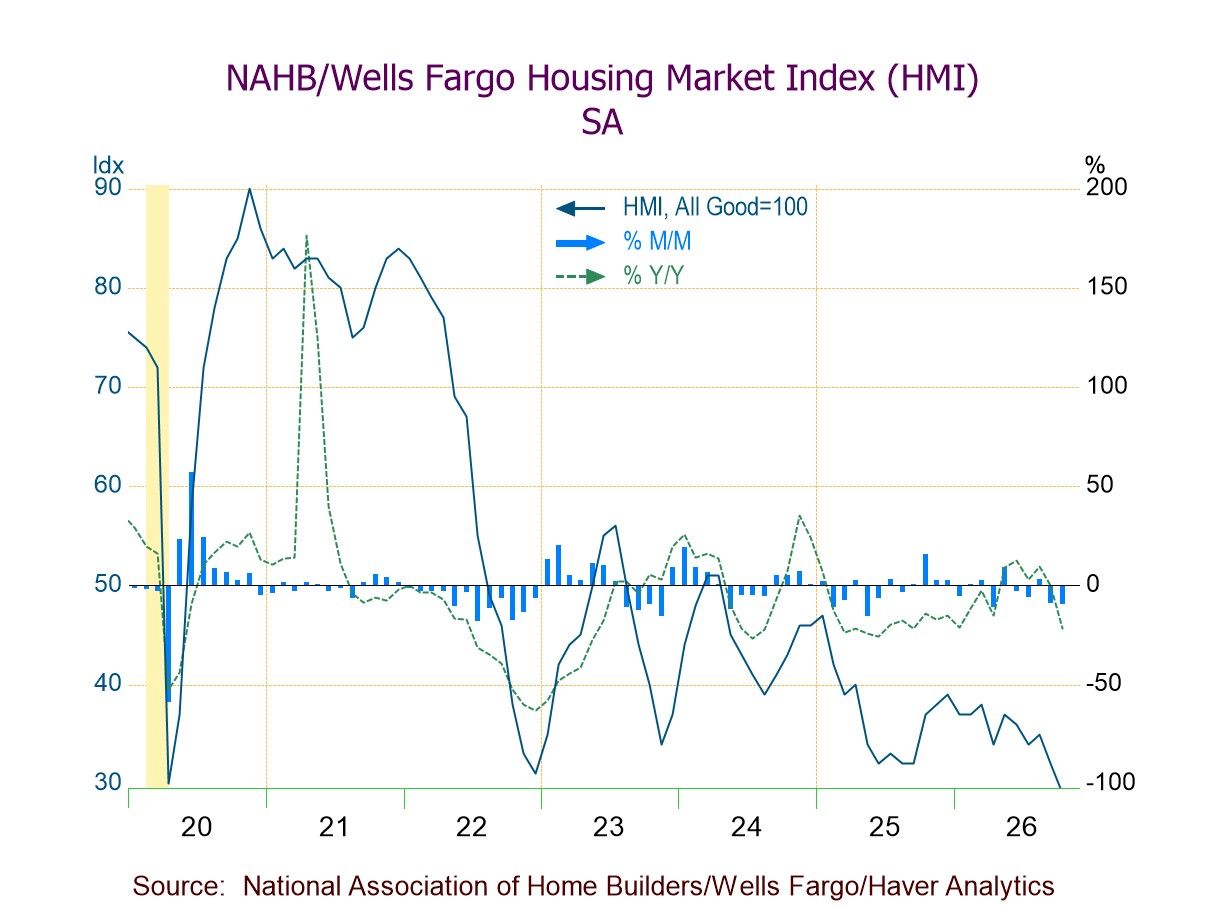
- HMI weakens m/m for the fourth time in five mths. in Oct., indicating most builders remain pessimistic about the current and near-term housing outlook.
- All three HMI components down, w/ the steepest m/m drop in prospective buyer traffic (-21.7%).
- Mixed regional performance m/m: down in the West (-33.3%), Midwest (-12.5%) and South (-6.9%); up in the Northeast (+5.7%).
 Japan| Oct 19 2026
Japan Shows Growth Progress and Ongoing Weakness
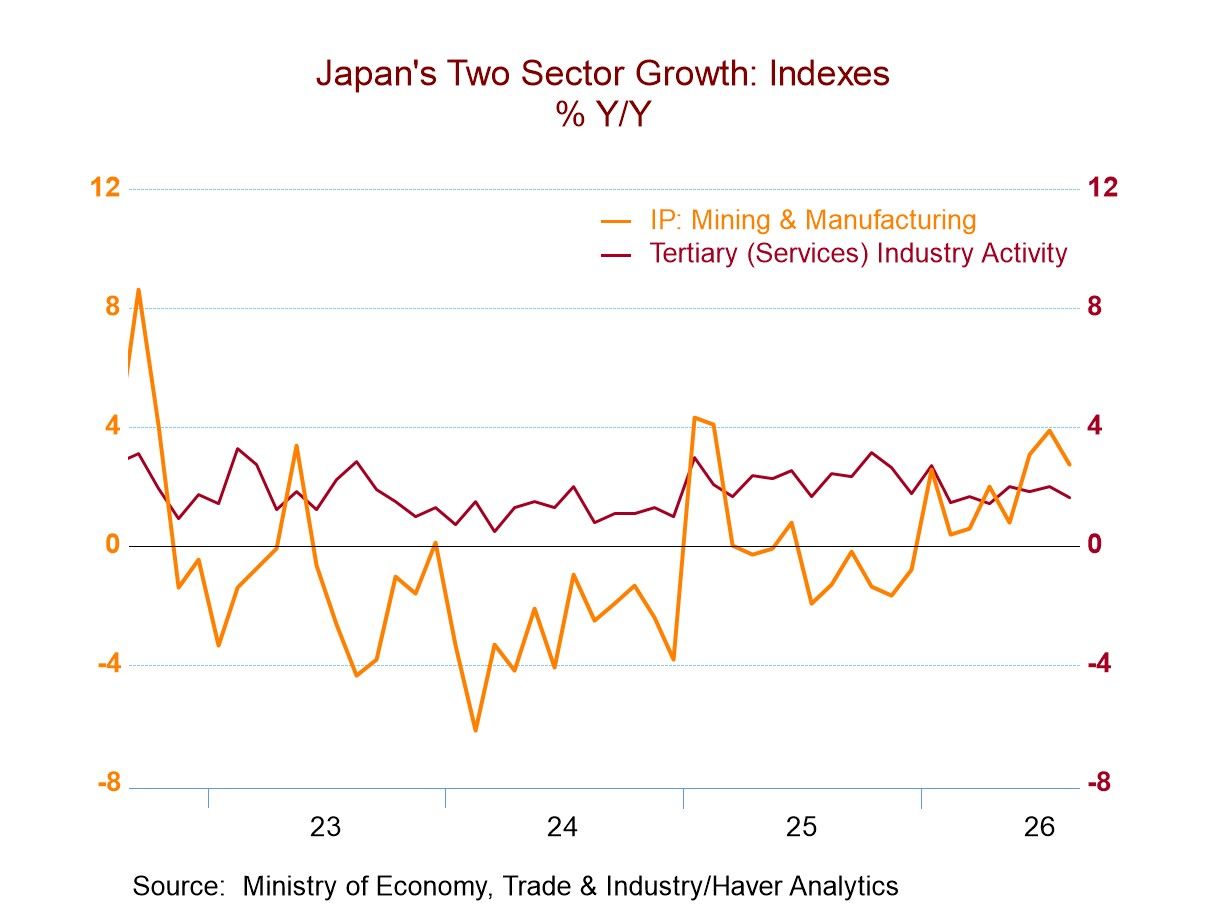
Japan’s sector surveys are showing some progress. However, the most recent observation from the METI sector indexes shows that the tertiary sector in August, which is the services sector in Japan, eased slightly to an index level of 106.8 from 106.9 in July. The rank for this sector based on growth over the last year is in its 64.1 percentile standing; that compares to the industry index that actually stepped down more sharply in August to 101.9 from 104.4 but still has a growth rank in the 84th percentile. The METI indexes can also be ranked according to the index levels rather than their growth rates; on that basis, the tertiary index ranks much higher in its 98th percentile, while the industry index ranks only at its 18th percentile on data back to 2012. You can see that a lot of this is from the post-COVID period since the change in the index from January 2020 to date is a decline of 6.3% for the industry index and an increase of 4.6% for the tertiary index. Japan's economy has clearly been hobbled since the onset of COVID and the recovery from it.
While the METI sector indexes show weakness in August, the leading economic index rose to a level of 118 from a level of 117.6 in July; the year-over-year growth rate ranking of the LEI is in its 92.5 percentile, quite strong. The index level ranked back to 2012 on the same timeline as the METI indexes has a 98.3 percentile standing. These are very different takes on the economy compared to METI, albeit based on different conceptual readings.
Economy Watchers Other indexes weighing in on growth in the Japanese economy come from the economy watchers index, where that overall index rose in August to a diffusion value of 46.4 from 45.7 in July. Over the past year, its growth rate (for the change in the diffusion index) ranked in its 53.5 percentile, while its index level rank is only in its 36.6 percentile. The economy watcher shows a year-over-year growth ranking above the 50th percentile for the retail sector, for eating & drinking places, for employment, and for the future index, with only the services sector lagging behind at the 40th percentile standing. However, when we rank the levels of these sector indexes, which are diffusion indexes, only the eating & drinking places category has a percentile standing above the 50th percentile, which means it's the only sector above its median value on data back to 2012. Meanwhile, all the August values for the diffusion readings themselves are below 50, indicating sector contraction across the board.
Teikoku A separate set of readings comes from Teikoku, where the manufacturing and wholesaling indexes both have readings above the 50th percentile, at the 59th percentile for wholesaling and at the 81st percentile for manufacturing. These are also diffusion indexes; if we look at the levels of the indexes, both manufacturing and wholesaling also have level rankings that are strong in the 80th percentile for manufacturing and in the 64th percentile for wholesaling. Retailing is at the 43rd percentile standing, while services and construction are weaker, with readings closer to their lower third, at the 34th percentile standing for services and at the 35th percentile standing for construction. Like the economy watchers index, these are also diffusion indexes and all of the raw diffusion readings are below 50, showing sector contraction in August.
Every sector tells a story These various indexes tell differing stories depending on the index doing the telling. But the stories aren't so different overall. They show generally that the manufacturing sector is doing well recently, although industry ranks much lower in the METI framework than manufacturing ranks in the Teikoku framework. Services have a sub-50 percentile standing for both growth and level in both the economy watchers and the Teikoku framework, whereas in the METI framework, the services sector is above its median on the same timeline. One of the reasons for the weaker industrial index in the METI framework is that the designation ‘industry’ mixes manufacturing with mining, and the mining sector has been lagging. The differences in the services categories are harder to explain, with much stronger growth in both the ranking and the levels in the METI framework compared to the economy watchers or the Teikoku. However, in the economy watchers segment, the employment index growth rank is quite high in the 71st percentile, but in level terms it's still weak at the 30th percentile. That seems to provide a sort of halfway house to understanding the differences. From that index, it would appear that recent employment growth has picked up, very likely underpinning the services sector. However, the employment index, compared to where it's been historically, remains weak; that leaves the strong reading for the tertiary index ranking as the odd man out and harder to explain.
 Asia| Oct 19 2026
Economic Letter from Asia: Chips and Rice
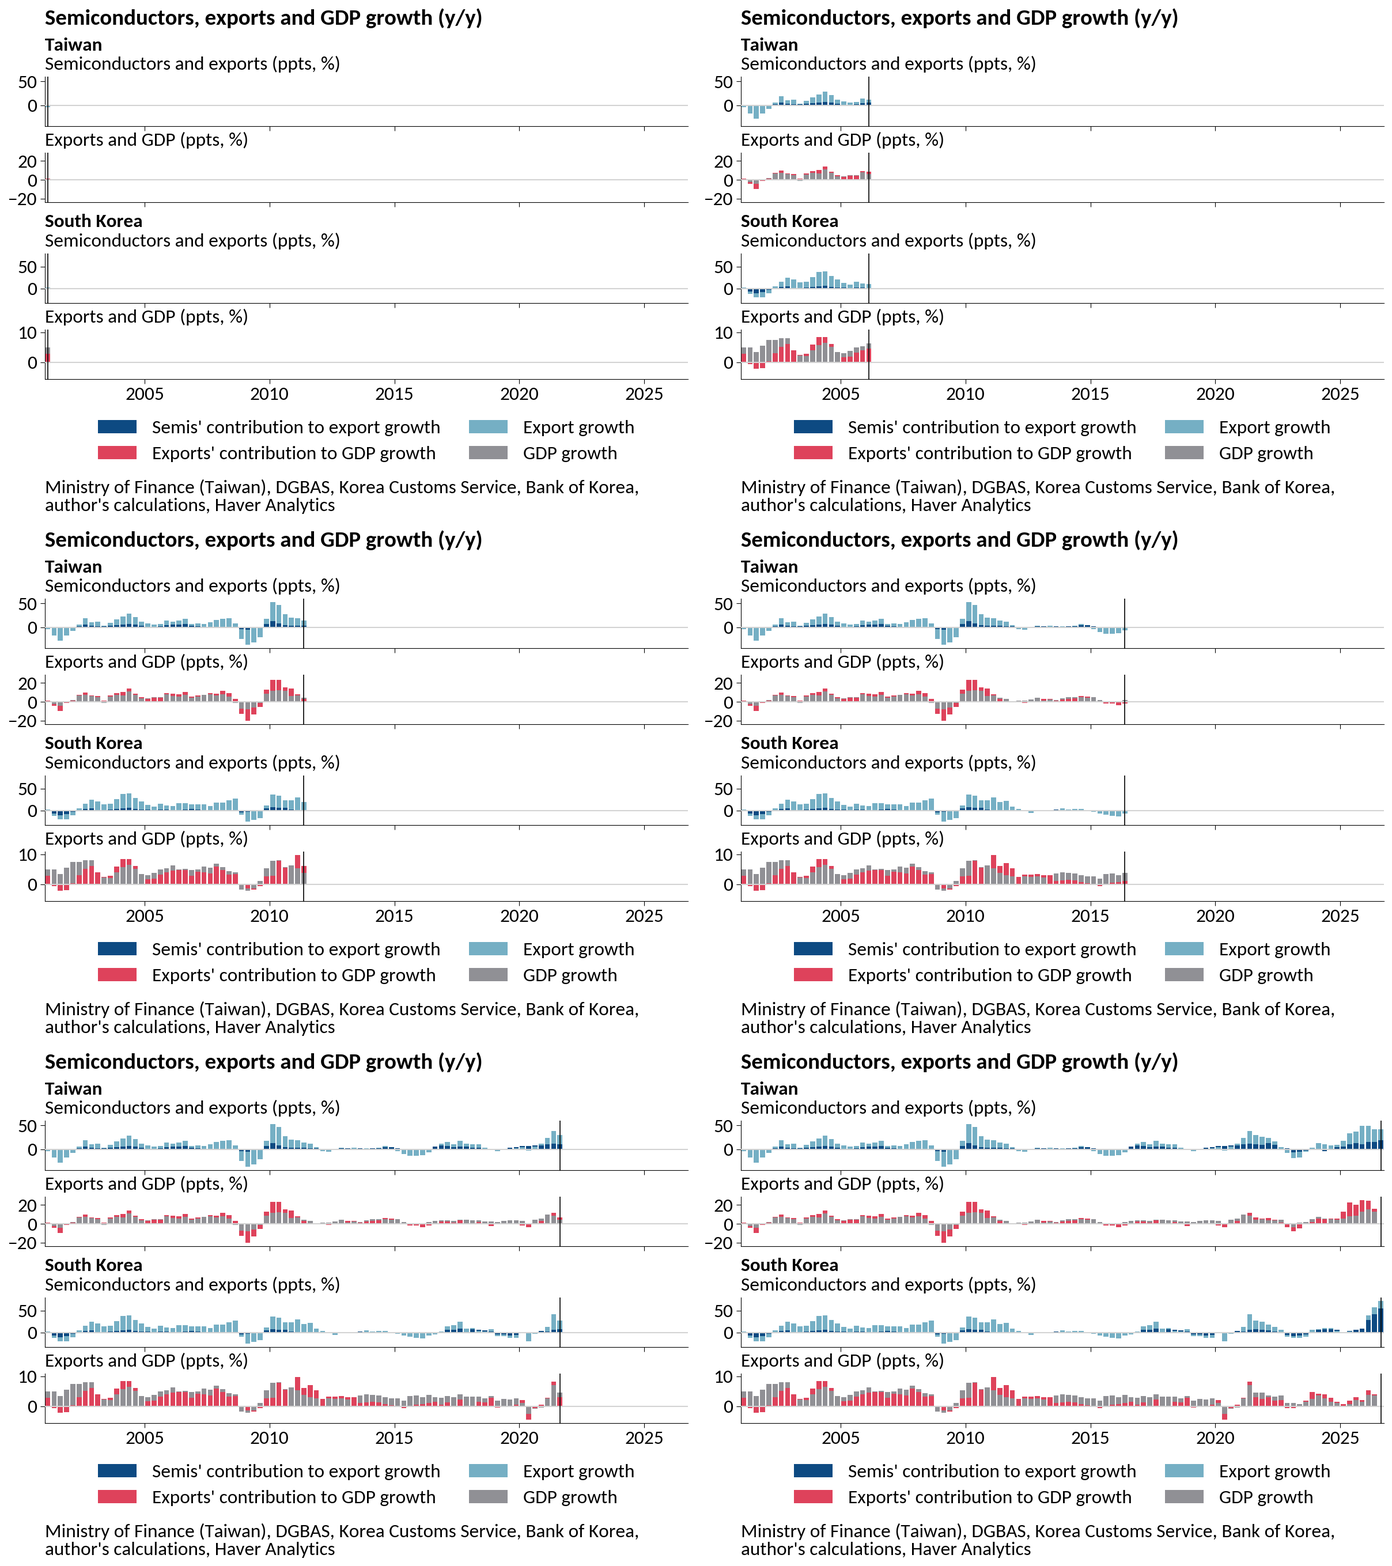
In this week’s Letter, we examine Asia’s contrasting fortunes in the IMF’s latest forecasts: strong growth among the economies benefiting from the AI boom, and rising inflation among those exposed to energy and food price shocks. The October WEO leaves the global growth forecast unchanged from April, but Taiwan and South Korea have received sharp upgrades, while Thailand and the Philippines face the largest upward inflation revisions among the Asian economies shown (chart 1). The gains in the two chip exporters rest heavily on semiconductor shipments, with exports at times contributing more to GDP growth than the headline rate itself (chart 2). That positioning captures substantial rent from the AI upcycle, yet it also concentrates risk. This month’s chipmaker-led selloff, sparked by a Chinese memory breakthrough, showed how quickly a single sector can drag down entire benchmarks (chart 3). The same exposure applies to growth, should competition intensify or demand falter. On inflation, Thailand and the Philippines have already absorbed an energy spike from the continued closure of the Strait of Hormuz (chart 4). A potential food shock now threatens to add a second layer, with rice futures rising and global production set to fall as a strong El Niño takes hold (chart 5). China, finally, saw growth pick up to 4.5% y/y in Q3, at the floor of its 4.5% to 5% target. Yet its two-speed pattern persists, with booming exports outpacing contracting investment and weak consumption, leaving growth reliant on external demand (chart 6).
The latest IMF WEO forecasts The IMF’s October World Economic Outlook keeps global growth at 3.1% for 2026 compared to April forecasts, but the stable aggregate masks a marked reallocation across economies. Taiwan and South Korea stand out in Asia (chart 1), with Taiwan’s 2026 growth forecast roughly doubles to above 10%, while South Korea’s rises from below 2% to above 3%. Both upgrades owe much to the AI buildout, given their role as major producers and exporters of related goods. Inflation tells a different story. Thailand and the Philippines, along with the US and the euro area, all carry higher CPI forecasts than in April, shown by rightward shifts in the chart. The drivers are several and affect each economy with differing intensity. One is elevated oil prices, as the Strait of Hormuz remains effectively closed to commercial shipping. Another is food, as El Niño begins to weigh on crops. For China, growth expectations are little changed at 4.5%, but the price outlook has softened further, with average inflation now seen near 1%.
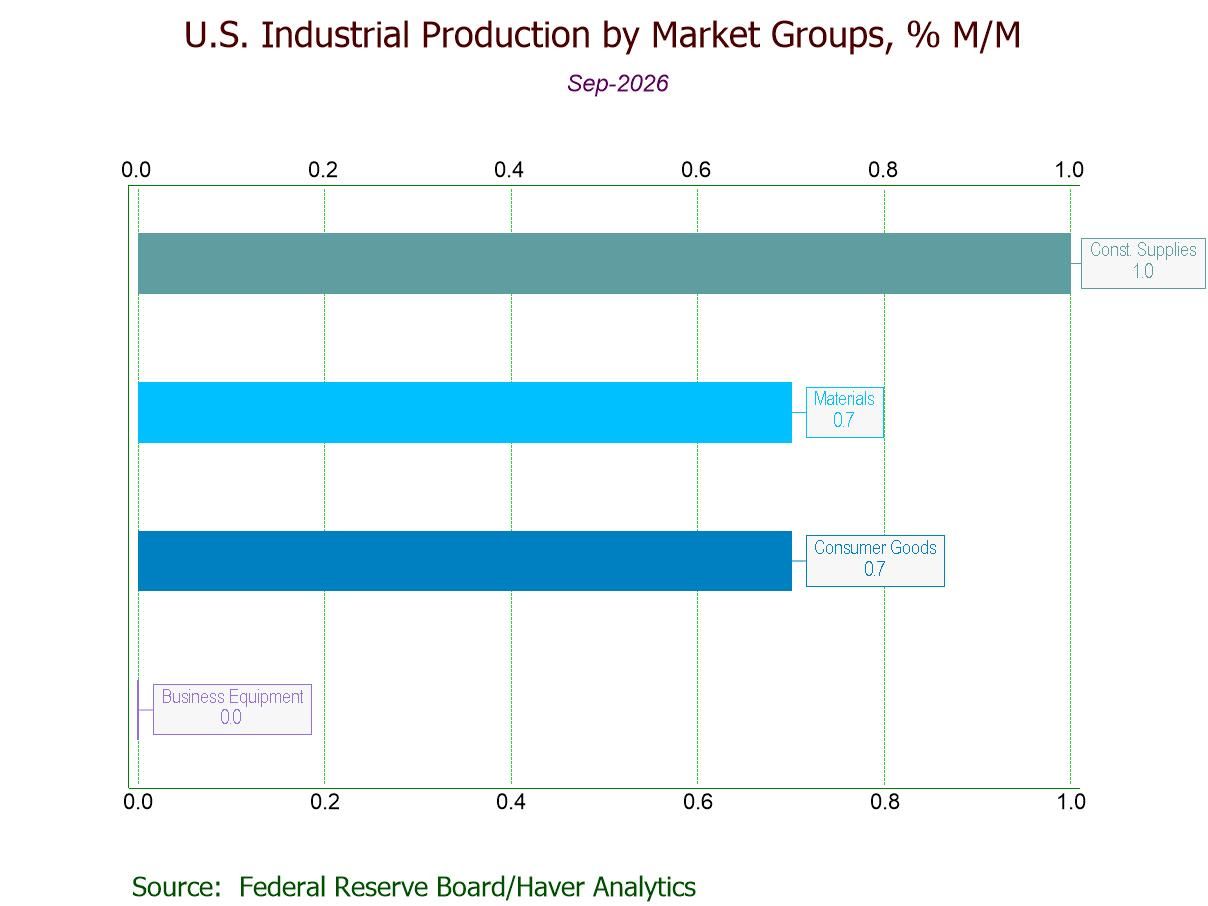
- September IP +0.7% (+2.2% y/y), sixth consecutive m/m increase; on an upward trend.
- Manufacturing +0.3% (+1.1% y/y), seventh rise in eight mths., w/ durables +0.1% and nondurables +0.4%.
- Selected high-tech +1.5%, sixth straight m/m gain; motor vehicles -3.0%, third successive m/m drop.
- Utilities +3.5% (+8.7% y/y), fifth rise in six mths., led by a 3.7% jump in electric utilities output.
- Mining +0.2% (+2.8% y/y), up for the sixth month running.
- All key categories in market groups gain m/m except business equipt. (0.0%).
- Capacity utilization up to 76.9%, highest since Dec. ’23; mfg. capacity utilization up to 75.9%.
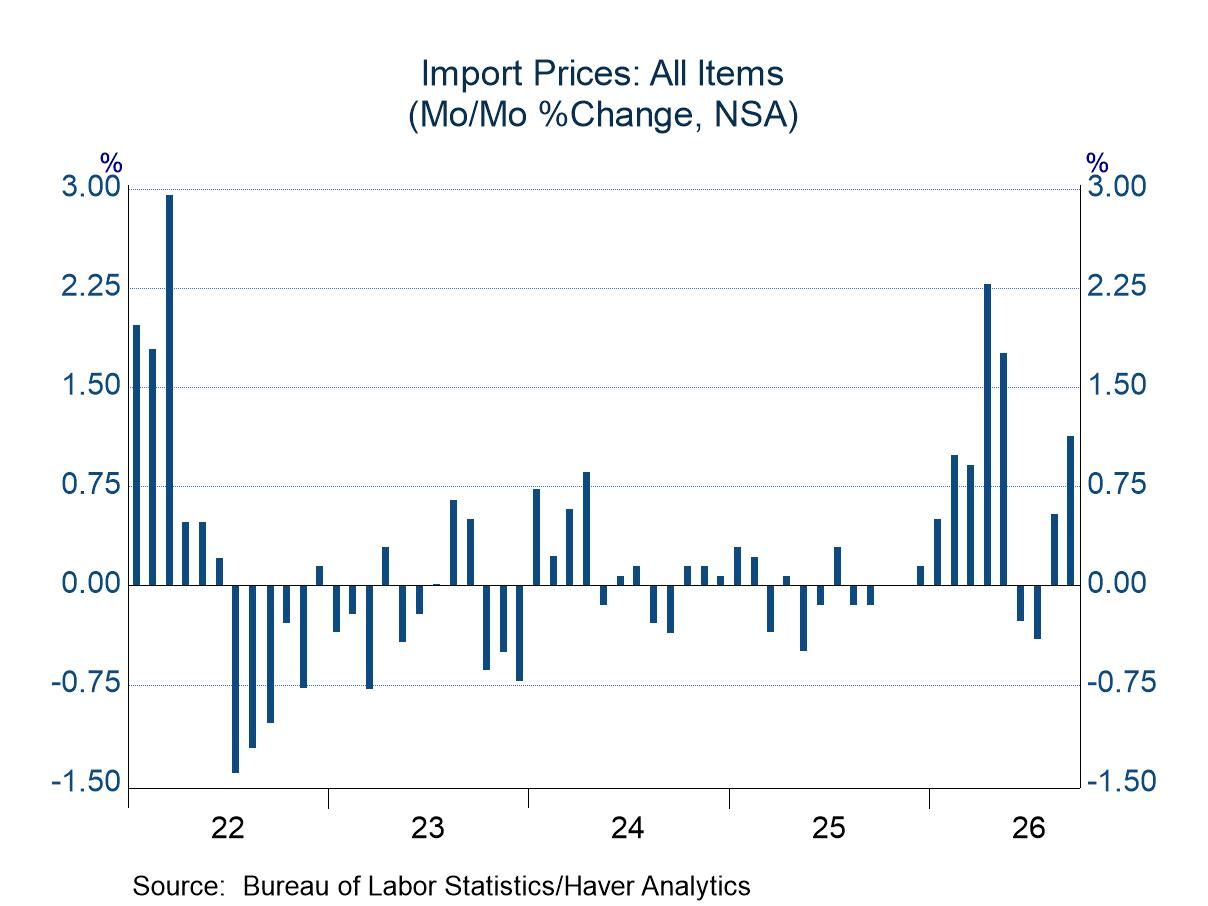
- Higher prices of industrial supplies and capital goods stand out.
- Prices of motor vehicles and non-auto consumer goods are stirring.
- of4Go to 1 page