Japan Shows Growth Progress and Ongoing Weakness
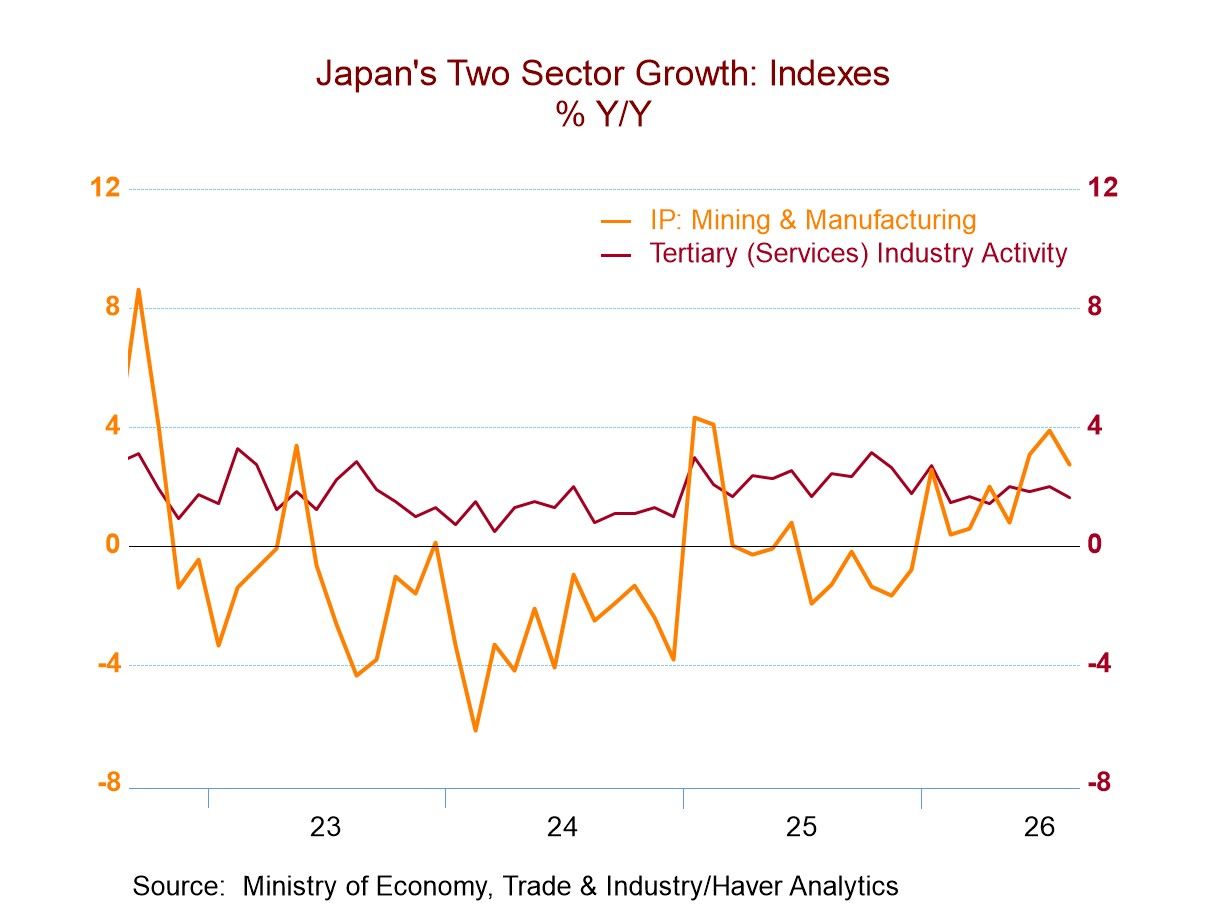
Japan’s sector surveys are showing some progress. However, the most recent observation from the METI sector indexes shows that the tertiary sector in August, which is the services sector in Japan, eased slightly to an index level of 106.8 from 106.9 in July. The rank for this sector based on growth over the last year is in its 64.1 percentile standing; that compares to the industry index that actually stepped down more sharply in August to 101.9 from 104.4 but still has a growth rank in the 84th percentile. The METI indexes can also be ranked according to the index levels rather than their growth rates; on that basis, the tertiary index ranks much higher in its 98th percentile, while the industry index ranks only at its 18th percentile on data back to 2012. You can see that a lot of this is from the post-COVID period since the change in the index from January 2020 to date is a decline of 6.3% for the industry index and an increase of 4.6% for the tertiary index. Japan's economy has clearly been hobbled since the onset of COVID and the recovery from it.
While the METI sector indexes show weakness in August, the leading economic index rose to a level of 118 from a level of 117.6 in July; the year-over-year growth rate ranking of the LEI is in its 92.5 percentile, quite strong. The index level ranked back to 2012 on the same timeline as the METI indexes has a 98.3 percentile standing. These are very different takes on the economy compared to METI, albeit based on different conceptual readings.
Economy Watchers Other indexes weighing in on growth in the Japanese economy come from the economy watchers index, where that overall index rose in August to a diffusion value of 46.4 from 45.7 in July. Over the past year, its growth rate (for the change in the diffusion index) ranked in its 53.5 percentile, while its index level rank is only in its 36.6 percentile. The economy watcher shows a year-over-year growth ranking above the 50th percentile for the retail sector, for eating & drinking places, for employment, and for the future index, with only the services sector lagging behind at the 40th percentile standing. However, when we rank the levels of these sector indexes, which are diffusion indexes, only the eating & drinking places category has a percentile standing above the 50th percentile, which means it's the only sector above its median value on data back to 2012. Meanwhile, all the August values for the diffusion readings themselves are below 50, indicating sector contraction across the board.
Teikoku A separate set of readings comes from Teikoku, where the manufacturing and wholesaling indexes both have readings above the 50th percentile, at the 59th percentile for wholesaling and at the 81st percentile for manufacturing. These are also diffusion indexes; if we look at the levels of the indexes, both manufacturing and wholesaling also have level rankings that are strong in the 80th percentile for manufacturing and in the 64th percentile for wholesaling. Retailing is at the 43rd percentile standing, while services and construction are weaker, with readings closer to their lower third, at the 34th percentile standing for services and at the 35th percentile standing for construction. Like the economy watchers index, these are also diffusion indexes and all of the raw diffusion readings are below 50, showing sector contraction in August.
Every sector tells a story These various indexes tell differing stories depending on the index doing the telling. But the stories aren't so different overall. They show generally that the manufacturing sector is doing well recently, although industry ranks much lower in the METI framework than manufacturing ranks in the Teikoku framework. Services have a sub-50 percentile standing for both growth and level in both the economy watchers and the Teikoku framework, whereas in the METI framework, the services sector is above its median on the same timeline. One of the reasons for the weaker industrial index in the METI framework is that the designation ‘industry’ mixes manufacturing with mining, and the mining sector has been lagging. The differences in the services categories are harder to explain, with much stronger growth in both the ranking and the levels in the METI framework compared to the economy watchers or the Teikoku. However, in the economy watchers segment, the employment index growth rank is quite high in the 71st percentile, but in level terms it's still weak at the 30th percentile. That seems to provide a sort of halfway house to understanding the differences. From that index, it would appear that recent employment growth has picked up, very likely underpinning the services sector. However, the employment index, compared to where it's been historically, remains weak; that leaves the strong reading for the tertiary index ranking as the odd man out and harder to explain.

Robert Brusca
AuthorMore in Author Profile »Robert A. Brusca is Chief Economist of Fact and Opinion Economics, a consulting firm he founded in Manhattan. He has been an economist on Wall Street for over 25 years. He has visited central banking and large institutional clients in over 30 countries in his career as an economist. Mr. Brusca was a Divisional Research Chief at the Federal Reserve Bank of NY (Chief of the International Financial markets Division), a Fed Watcher at Irving Trust and Chief Economist at Nikko Securities International. He is widely quoted and appears in various media. Mr. Brusca holds an MA and Ph.D. in economics from Michigan State University and a BA in Economics from the University of Michigan. His research pursues his strong interests in non aligned policy economics as well as international economics. FAO Economics’ research targets investors to assist them in making better investment decisions in stocks, bonds and in a variety of international assets. The company does not manage money and has no conflicts in giving economic advice.
More Economy in Brief
 Asia