Haver Analytics
Haver Analytics

Economy in Brief: 2022

  • China is under enormous strain as there are grassroots demonstrations and pushbacks to its zero COVID policy. Protests have spread and risen in intensity over the policy and its recent setbacks. Still, this is China, and protesting can be dangerous to your health. It is still not clear if this is mostly a young people's protest or if it's something that is broader. However, it's occurring only slightly after Prime Minister Xi has entrenched his power and put all his allies into key policy positions. There is widespread discontent - particularly over people who are under lockdown and because there was a fire and people died in the fire when response was poor. It's not clear that this protest will have legs or will reach the critical mass of something broader.

    However, protesting, like lockdowns, interrupts economic activity, too. And we see in November more economic backtracking in both the manufacturing and the nonmanufacturing PMIs for China.

    The manufacturing survey shows the headline PMI reading for manufacturing lower on the month at a standing in the lower 3 percentile of all data since 2005. Orders also weakened in the month and show a 4.2 percentile standing. Output weakened to 47.8 in November from 49.6 in October and has a 3.7 percentile standing. The standings of the manufacturing components are all in fact quite weak; the one exception as is often the case when conditions are deteriorating is for stocks. This is often because when an economy slows down and demand slows down, stocks begin to pile up. Rising stocks are an indication that production is no longer behind servicing demand, but in a slowdown or recession that is because demand has imploded. In China, demand is weak and disrupted by its zero COVID policy.

    As in November, all the components in the survey have weakened month-to-month except for stocks of finished goods. And all of them except for input prices have diffusion values below 50 indicating that that components are contracting. All components except input prices show contraction for two months running. Most components show contractions for three-months running with the exception being the headline manufacturing PMI gauge, output, input prices, and purchases of inputs. The weakness as you can see is quite broad based and persistent.

    The sequential readings on period averages show all averages below 50 except for input prices over three months. Over six months only output does not average below 50 instead clocking a reading of 50.2; an extremely slight increase in output is indicated. Over 12 months there are declines in the headline PMI and all the components except for input prices that have a value of 53.6. Even China has some inflation; not as much as in the West but some.

  • The Belgian CPI has strong correlations with both German and EMU-wide inflation measures; the deceleration of headline inflation for the Belgian CPI in November is good news. The year-over-year pace in October had been 12%; in November the year-over-year pace migrates down to 10.6% over 12 months. The CPI core rate also is slightly easier rolling in at a 6.1% annual gain in October and ticking lowered to a 6.0% pace in November. Of course, we're looking at month-to-month comparisons of year-over-year gains and, in the case of the core, looking at a very tiny deceleration. However, markets are grasping at straws for good news and there are at least several hints of good news in this report.

    Beyond those headlines, we see that inflation on a year-over-year basis still has diffusion of 100% in November as it did in October. Both months show acceleration in the underlying pace of inflation and all the CPI categories compared to the one-year ago pace. Headline inflation may be accelerating, but disaggregated, across all categories it's showing a diminishing tendency to do that.

    Sequential inflation provides the less pleasant message here. The CPI headline at 10.6% over 12 months races at a stronger 11.7% pace over six months and rises to a 13.3% pace over three months. The CPI core provides less clear guidance as it rises at 6% pace over 12 months then at a 6.8% pace over six months and then falls back to a 6% pace over three months leaving us with an unclear message about 'trend.'

    Inflation diffusion, which compares the breadth of inflation in each period to the period before, is at 100% over 12 months. Inflation accelerates in all categories over 12 months; that proportion falls to 70% over six months comparing the six-month pace to the 12-month pace. Over three months inflation diffusion falls to a still strong 60%; that compares inflation over three months to six months. Diffusion data show that the breadth of inflation acceleration is narrowing from 12-months to six-months to three-months rather steadily. This is the opposite message from the headline and is a message that may be more consistent with the core pace that doesn't have a clear message on the path of inflation itself.

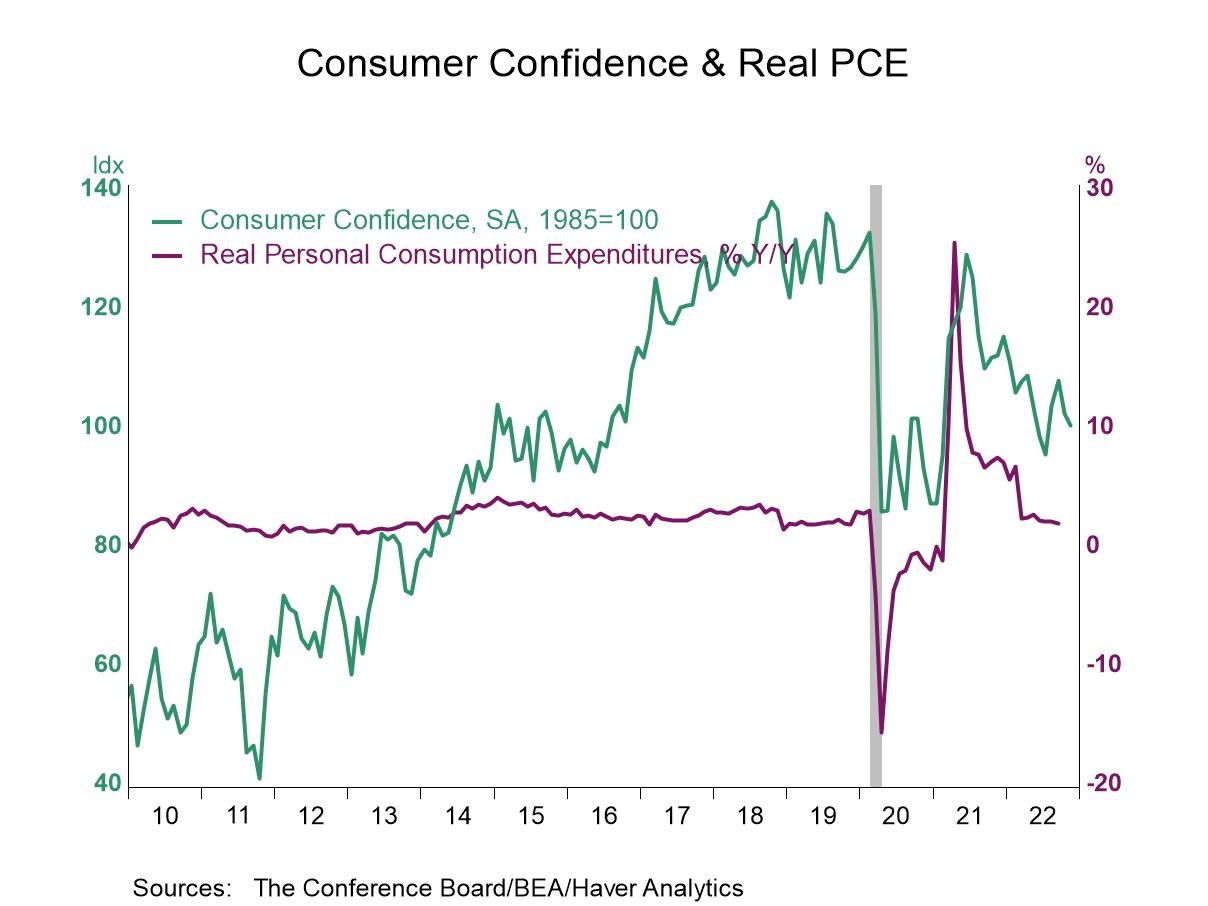
    • Present situation reading is lowest since April 2010.
    • Overall expectations dim for second month.
    • Inflation expectations rise again.
    • FHFA HPI +0.1% m/m in September following two straight monthly declines.
    • House prices rebound m/m in six of nine census divisions; house prices fall in New England, the Mountain region, and the West South Central region.
    • Gasoline prices continue to weaken.
    • Crude oil prices fall to January low.
    • Natural gas prices increase modestly.
    • Index is negative for seventh consecutive month.
    • New orders, production & employment are under pressure.
    • Pricing power deteriorates sharply.
  • GfK provides a lookahead confidence measure for Germany. For December, the confidence measure logs a -40.2 reading; this is a slight improvement from -41.9 in November and -42.8 in October, but it's still considerably weaker than September's -36.8 and August value of -30.9. German confidence clearly has moved to an even lower level over the last three months, and it continues to hover in this lower position.

    The components of the climate index lag the headline by one month. They offer data for November: economic expectations improved in November to -17.9 from -22.2. Income expectations improved to -54.3 from -60.5 while the propensity to buy worsened slightly to -18.6 from -17.5.

    The count or rank standings for these metrics give us a better idea of where confidence sits in absolute terms. The climate index has been weaker 0.8% of the time (only in the previous two months!). Economic expectations have been lower 11.6% of the time. Income expectations have been lower 0.8% of the time. The propensity to buy has been weaker 17.3% of the time. The propensity to buy metric is significantly less weak than the other components; however, it is still quite dramatically weak because the 17 percentile standing means that it's weaker than this less than one-fifth of the time.

    The table also presents percentile standing data on where the components sit in their high-low range. Climate is at its 4.8 percentile mark. In other words, quite apart from how frequently the reading is lower, a separate question regards how low is it compared to its all-time low? Its lowest reading is only 4.8 percentage points below its current reading. The economic index has its all-time low only 14.6% lower than its current reading. Income expectations are only 10.4% lower. The propensity to buy lowest reading is 30.7% lower. Buying conditions are not as dramatically weak.

    So not only are the current readings weak and rarely weaker but most of them are quite close to their historic all-time lows, marking this as not just a difficult point but as an extremely distressed situation that has a great deal of absolute weakness.

    For comparison, I have the most up-to-date confidence data from Italy, France, and the United Kingdom as well. Those metrics lag by one month and are comparable in timing to the components for the German index as of November. Italian confidence improved sharply to 98.1 in November from 90.1 in October; French confidence improved to 83.4 from 82.1; and the U.K. confidence improved to -44.0 from -47.0.

  • _We have published this shorter edition of Charts of the Week earlier than normal owing to the US Thanksgiving holiday on Thursday. _ Investors have, on the whole, been taking a more positive view about the outlook for the world economy in the last couple of weeks in part because of evidence that the US inflation cycle may be turning. But there have been other fundamental factors that have – at the margin – contributed to a more upbeat market mood. For example, a sharp retreat in oil prices in the past few weeks – and their impact in lowering inflation expectations – ought to be good news for global growth as we underscore in our first chart this week. Incoming economic data have also been surprising the consensus on the upside more frequently in recent weeks, a trend that we highlight in our second chart. And finally, hopes have also risen that China may enact much less restrictive policies toward the COVID pandemic, which might unleash some pent-up demand, a point that we make via our final chart this week.