- Decline is to lowest level since July.
- New orders, employment & supplier deliveries drop.
- Despite a small gain, price index remains near ten-month low.
by:Tom Moeller
|in:Economy in Brief
 Global| Dec 01 2025
S&P MFG PMIs Remain Mixed
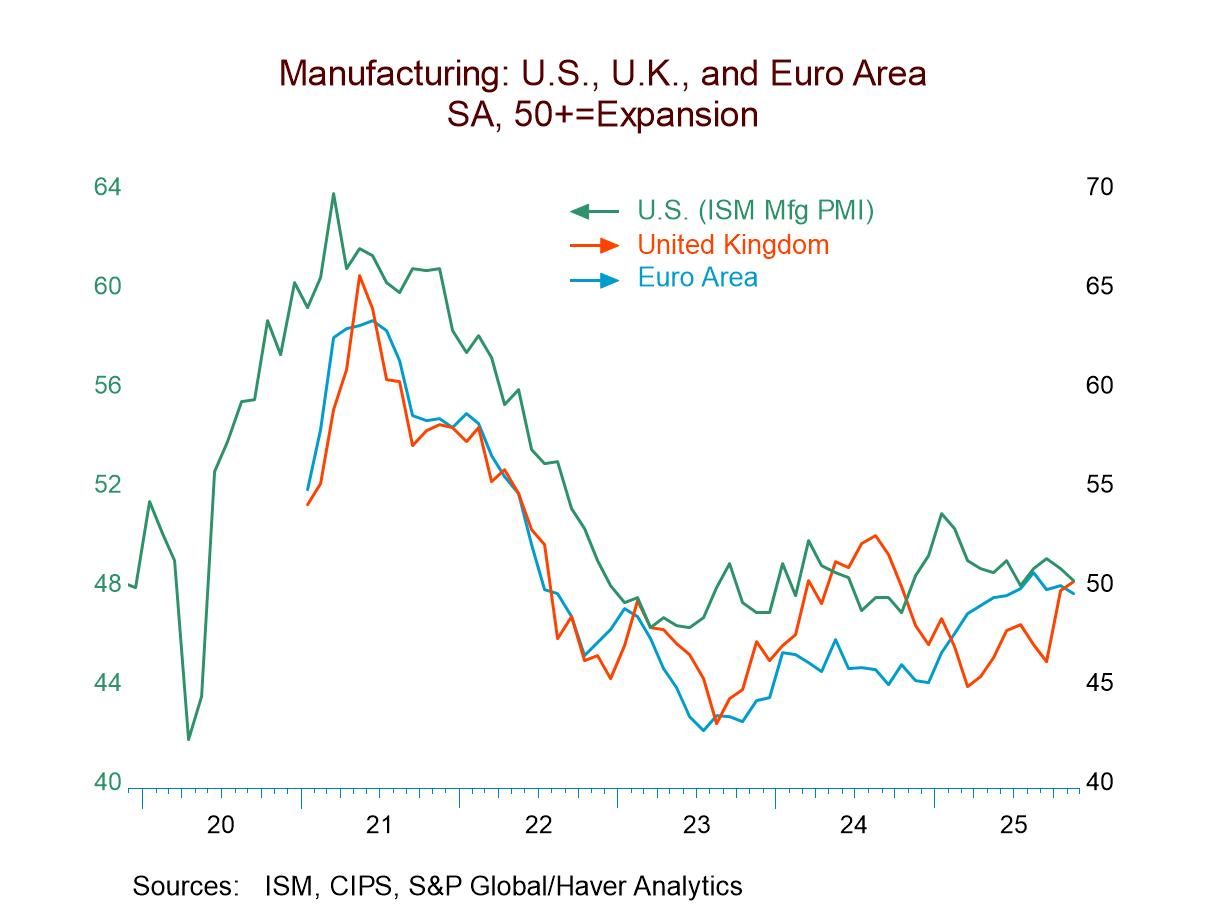
The S&P manufacturing PMIs for November show split results with 9 reporters showing improvement and 9 reporters showing deterioration. The median value among reporters in November is 49.0, exactly the same as its the three-month average, but it's a downtick from 49.5 in October. The split in terms of improving or deteriorating is 50/50 in November and that compares to 61.1% improving versus about 39% deteriorating in October. Both of these diffusion readings are a tremendous step up from September when only 11% of the reporters improved month-to-month.
Sequentially, there's hardly any change at all and none worth speaking about. All of the values for three-months, six-months, and 12-months are either 49.0 or 49.1. Now compared to 12 months ago shows a diffusion of 55.6, indicating relatively more improvement than deterioration. For six-months versus 12-months, diffusion is at 66.7, indicating about 2/3 are improving and only one-third deteriorating. However, over three-months compared to six-months, the split on diffusion is at 50%, a wholly neutral value.
The queue standings that rank the November observations on data back to January 2021 show above 50% readings for eight of the 18 reporters in the table. Above their 50% mark (which means above their medians) are the euro area, Germany, the United States, the United Kingdom, India, Indonesia, Malaysia, and Vietnam. The global manufacturing results from the JP Morgan index which employs weighting is much higher at 68.4 percentile and compares to an unweighted Asian average of 54.7%, and the total average at 45.8%. Neither of the two average statistics employ weighting.
Assessing the change in manufacturing from January 2021 across the 18 reporters, only four have manufacturing indexes that are higher than they were at that time; those reporters are Mexico, Indonesia, Malaysia, and Vietnam.
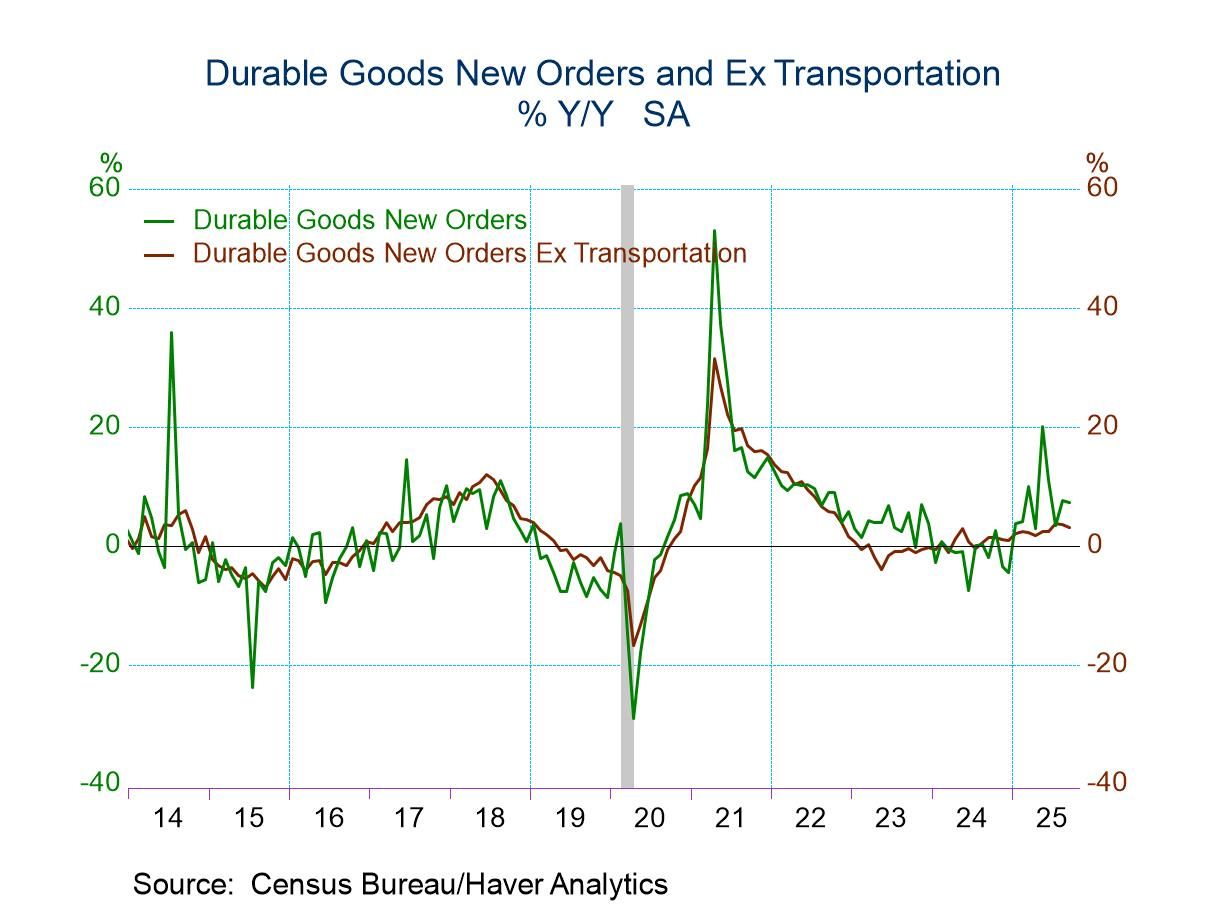
- Broad-based orders improvement follows August jump.
- Durable shipments gain reverses prior month’s dip.
- Order backlogs grow for second month; inventories ease.
by:Tom Moeller
|in:Economy in Brief
 USA| Nov 26 2025
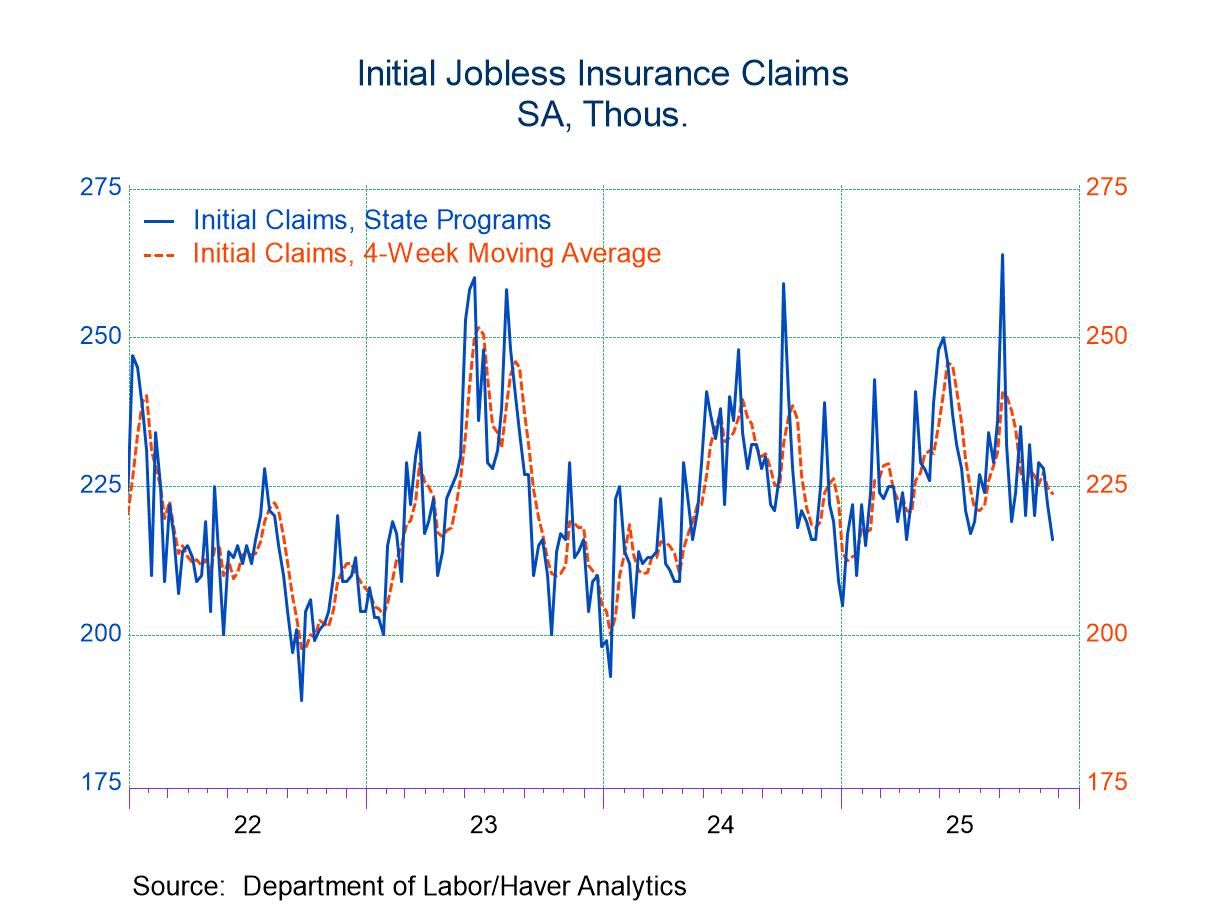
U.S. Initial Unemployment Insurance Claims Fell in Latest Week
- Initial unemployment claims fell to 216,000, the lowest weekly figure since April.
- Continued claims edged up to 1.96 million, indicating that the unemployed are still having increasing difficulty finding a job.
by:Sandy Batten
|in:Economy in Brief
 USA| Nov 26 2025
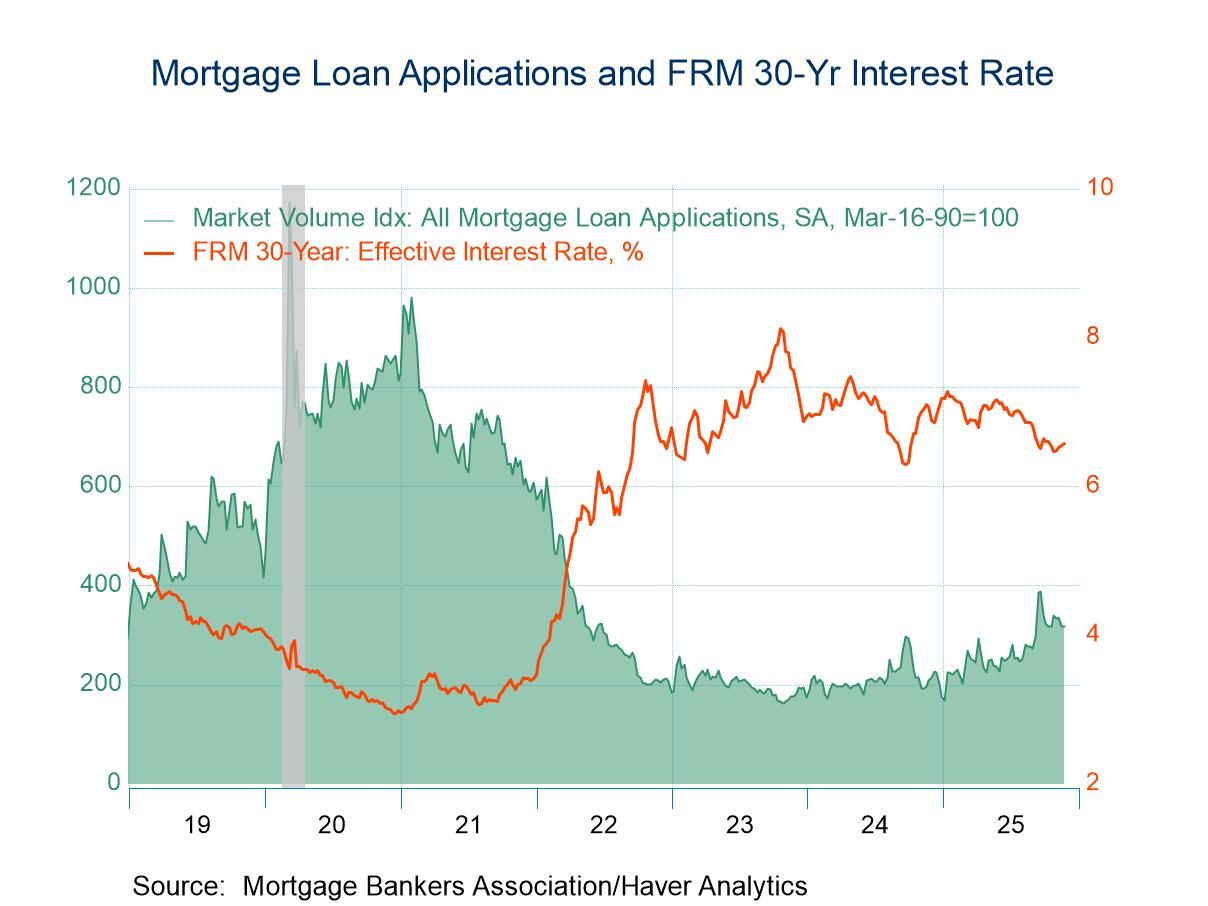
U.S. Weekly Mortgage Applications Inched Up in The Latest Week
- Applications for loans to purchase surged, while those for refinancing declined.
- Interest rates on 30-year fixed-rate mortgage inched up for the fourth consecutive week.
- Average loan size rose in the latest week.
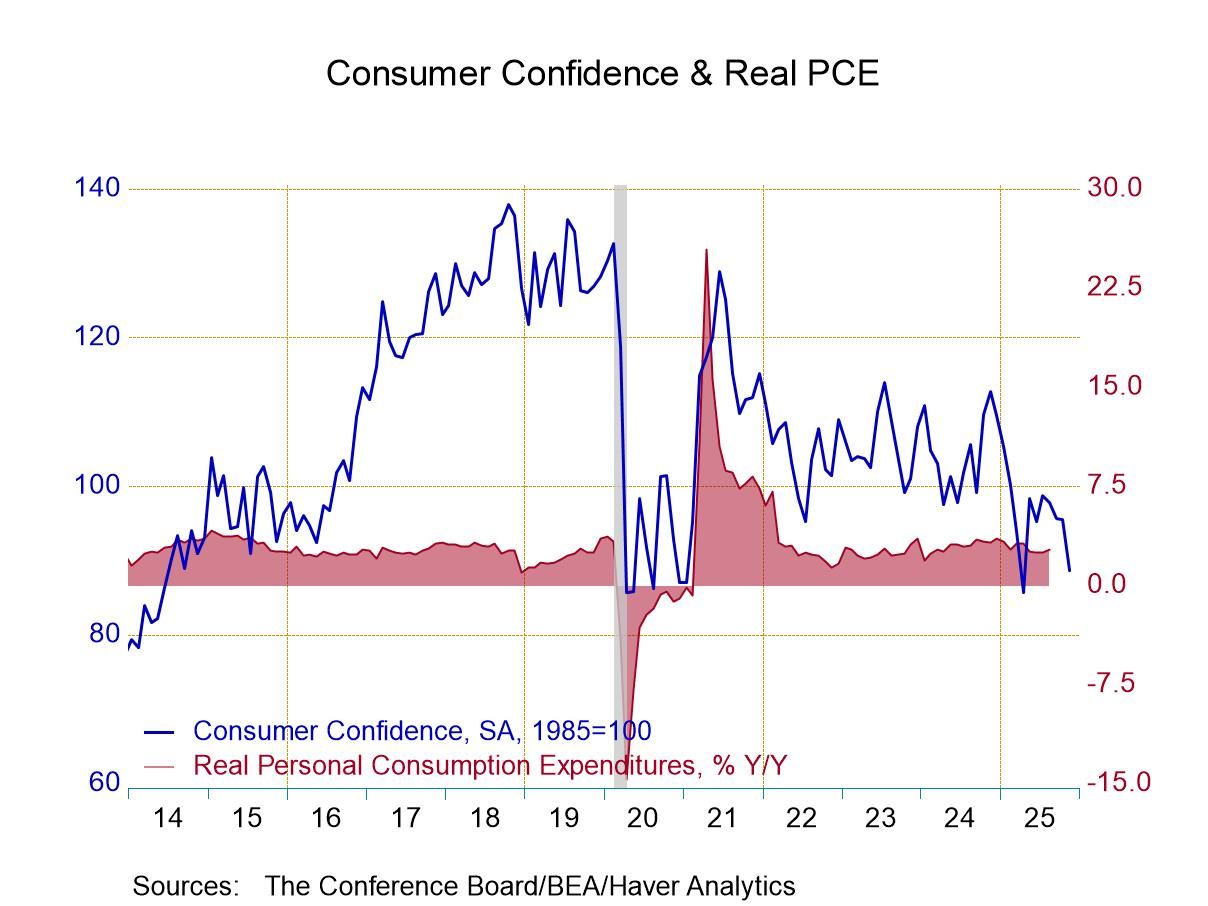
- Confidence level moves to lowest since April.
- Present situation index and expectations decline.
- Inflation expectations are contained.
by:Tom Moeller
|in:Economy in Brief
 USA| Nov 25 2025
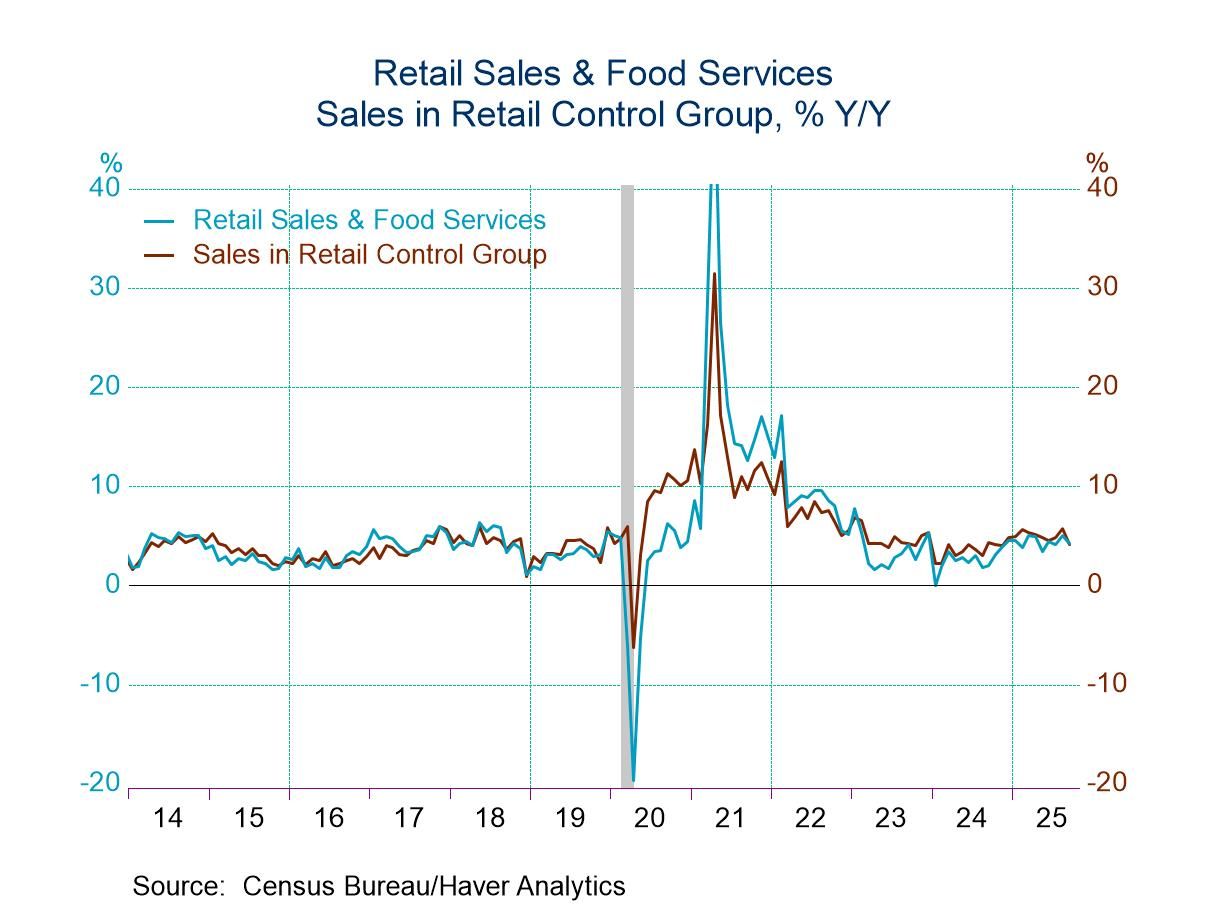
U.S. Retail Sales Post Limited Rise in September
- Auto sales decline; rise in nonauto sales is restrained.
- Sales ease in retail control group.
- Clothing & nonstore sales decline.
by:Tom Moeller
|in:Economy in Brief
 USA| Nov 25 2025
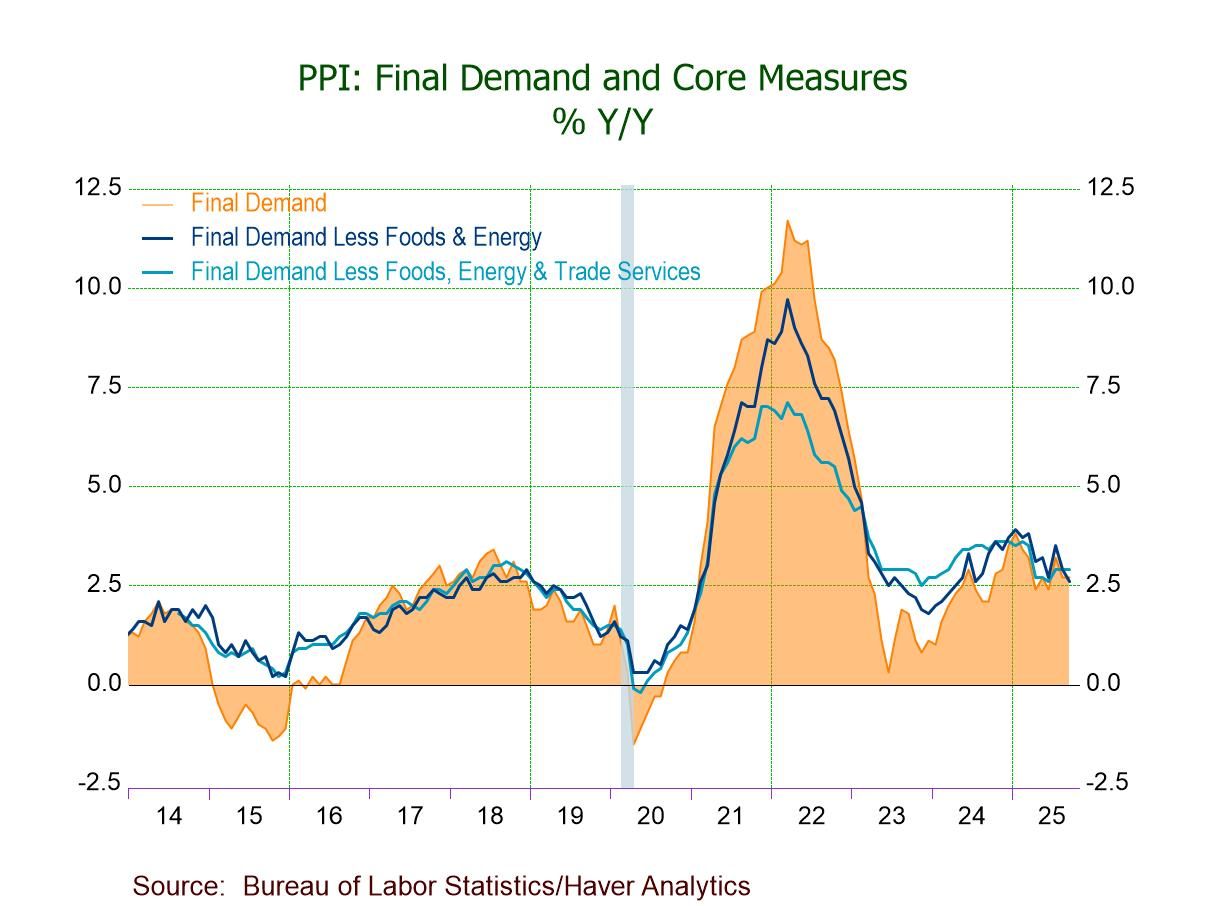
U.S. Producer Prices Rise in September Led by Energy
- Sept. PPI increases 0.3% m/m (+2.7% y/y), driven by price rises of 3.5% in energy and 1.1% in foods.
- PPI ex foods & energy edges up 0.1%; prices for both services and construction hold steady.
- Core goods prices increase 0.2% (+2.9% y/y) after a 0.3% August gain.
- Intermediate demand processed goods prices up for the fifth time in six months.
- of103Go to 8 page