- Pending home sales decline to lowest level since May 2020.
- Sales fall in most of country.
 USA| Mar 25 2022
U.S. Pending Home Sales Move Lower in February
by:Tom Moeller
|in:Economy in Brief

 Global| Mar 25 2022
Chika Boom Chika Bust: Money Supplies
Tight money isn't funny – but is it loose or tight? This month we encounter a bit of a dilemma in analyzing money supply growth. In the European Monetary Union (EMU), year-over-year M2 growth is at 6.8%. In the U.S. M2 money growth is at 11%, in the U.K. it's at 6.5%, and in Japan its pace is 3.6%. All of these are relatively robust rates of growth for nominal money supply. Money is plentiful. The question, however, is whether money has been too plentiful.
Inflation classically is described as too much money chasing too few goods. These statistics suggest that there has been plenty of money out there; however, in the wake of the pandemic, certainly in the U.S. where a lot of support monies were given to people who weren't working and weren't creating any output, there has come to be a maintenance of spending because there was a maintenance of income. However, there was a shortfall of supply and so with an abundance of money what we have is situation where there has been too much money chasing too few goods and probably more 'too-few goods' than 'too-much' money.
To a considerable extent, there seems to be a physical goods/services supply problem. The bigger problem seems to be that supply has been impeded and there haven't been enough goods and services around for people to purchase. Certainly, money supply statistics confirm in the sense that the 12-month growth rates are some of the lowest growth rates that we've seen from these countries, comparing the 12-month pace to the two-year average pace or the three-year average. Thus, the increase in money supply isn't particularly new nor is it robust and there is no acceleration.
Real money balances On the other hand, we can look at what's been going on with real monetary balances. This measure involves looking at nominal money supply growth with inflation subtracted from it. When we look at this measure, we find that over three-months and, for the most, part six-months real money balances are shrinking in the European Monetary Area and the U.K. In the U.S., three-month growth is negative but not six-month growth. For Japan, money-growth rates hover around 1% for real balances on this horizon.
Looking at the year-over-year rates, the European Monetary Union's money growth is 0.9%, in the U.S. it's 2.9%, in the U.K. it is 1.1%, and in Japan it is 2.6%. All these growth rates, of course, are substantially below their respective nominal counterparts because they're constructed by taking the nominal growth rate and subtracting inflation, at a time that inflation is accelerating. But what we see is that money supply growth has not been adequate to compensate for inflation and we're seeing that the growth in real monetary balances is barely enough to fuel any kind of decent real growth in many of these countries The U.S. is the marked exception since for the U.S. real balance growth is still at 2.9% over 12 months, which is still relatively robust. However, over shorter periods, real balance growth is impeding economic growth.
Credit in EMU Looking closer at the European Monetary Union, we see the credit to residents in nominal terms is up by just 4.1% over 12 months and by 4.4% for credit to the private sector. Look at these two measures, convert them to real terms, and the results change markedly. Credit to residents is falling 1.7% year-over-year and private credit is falling by 1.4% year-over-year. Clearly there is a pull-back in credit growth that is now becoming a drag on economic activity. While central banks haven't raised interest rates aggressively, they have controlled the growth rate of money supply and with that, the increase in inflation is creating a drag in terms of the provision of real money balances and real credit flows in the economy. That creates some braking effect on its own.
Oil trends The far-right hand column of the table also presents statistics on oil prices and there we see that oil prices are up by 56.1% over 12 months and this is for West Texas Intermediate (WTI) oil prices. Over 12 months, that same statistic, converted to real terms converted using the U.S. CPI, decelerates to a 44.6% gain. However, over three months and six months, the growth in real balances steps up from that 44% pace to growth rates in the 60% range.
There is no doubt in the age of Covid central banks were relatively easy with their money and credit growth, but fiscal policy was highly stimulative as well. Since inflation has picked up and there's concern about it. Central banks have paid a little bit more attention to money growth and some of them have started to raise interest rates and this is having some further impact on slowing the rate of money supply growth.
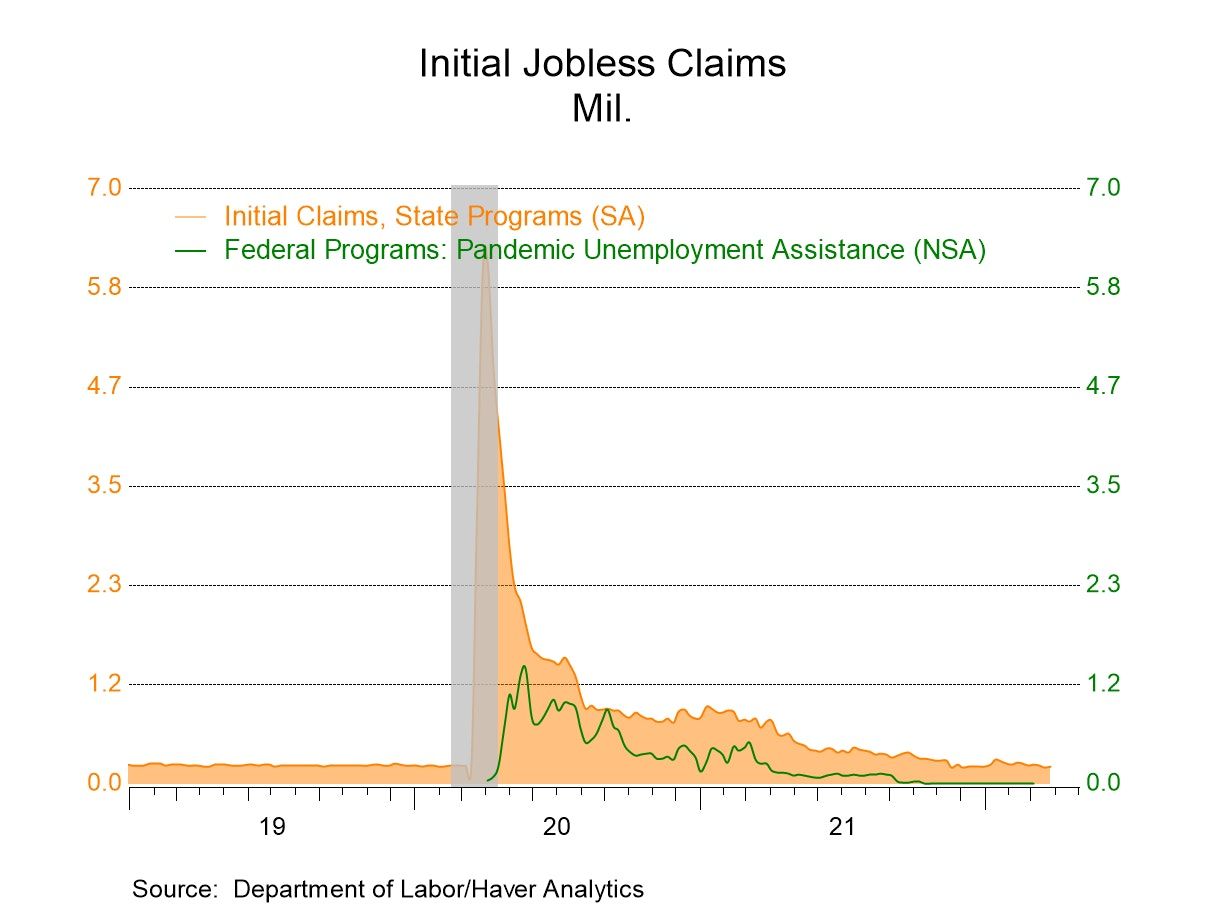
- Initial claims noticeably lower than forecast.
- Continued claims below pre-pandemic amounts.

- Component improvement is mostly positive.
- Expected conditions rise.
- Pricing power recoups February decline.
by:Tom Moeller
|in:Economy in Brief
 USA| Mar 24 2022
U.S. Current Account Deficit Narrowed Slightly in Q4
- Third largest quarterly deficit on record.
- Goods deficit widened to another record; services surplus widened slightly.
- Largest annual deficit in 2021 on record.
by:Sandy Batten
|in:Economy in Brief
 USA| Mar 24 2022
U.S. Durable Goods Orders Fall Unexpectedly in February
- Fewer aircraft orders lead downturn.
- Core capital goods orders ease following January surge.
- Shipments hold steady but backlogs & inventories increase.
by:Tom Moeller
|in:Economy in Brief
 Europe| Mar 24 2022
EMU PMIs Wither in March; Mixed Bag Elsewhere
PMIs in Europe are weakened on balance in March. The Composite Index for the EMU fell in March, driven lower by weaker conditions in manufacturing and in services. Germany had weaker conditions in March driven lower by weaker conditions in manufacturing and in services. France breaks the model of the EMU member with a stronger index overall boosted by strengthened services as the manufacturing was weaker on the month. The U.K. was weaker overall despite having a stronger service sector; its weakness was created by a weaker manufacturing sector. Japan saw strengthening across the board for its composite, manufacturing, and services as did the U.S. The U.K. has the strongest composite standing on the month, but the U.S. has the most uniform strong stands across sectors- the best balance. Japan is the weakest.
Sequential changes in lagged averages Looking at the sequential changes over 12 months over six months and over three months (calculated on one-month lagged averages that ignore preliminary data), those averages show that over 12 months all the indicators are stronger than they were twelve months ago. This applies to the composite, the indexes for manufacturing and services in each of the survey respondents. Over six months compared to 12 months, conditions are somewhat uneven. Japan shows strength across the board: for manufacturing, services and the composite. However, the U.K., Germany and the EMU show weaker conditions across the board. France shows mixed performance over six months as does the U.S. Over three months compared to six months, weakness prevails. However, manufacturing is stronger compared to six months in Japan, the U.K., France, and Germany. But manufacturing still weakens over three months compared to six months for the European Monetary Union as a whole- all EMU PMIs weaker over three months. The U.S. also shows a weaker composite and weaker components over three months on average data.
Queue standings compared The queue standings show the positioning of the composite indexes on data back to 2018. Readings are mostly upper mid-stream. There's a 72.5 percentile standing in the EMU, for Germany it's a 66.7 percentile standing, France is a bit stronger at the 78.4 percentile mark, the U.K. at 88.2 percentile. Japan, however, is weak with a 41.2 percentile composite. The U.S. composite stands at 82.4%. Manufacturing sector standings are all in the 60th to low 70th percentile except Japan at 82.4% and the U.S. at 80.4%. Services sector standings are firm-to-strong with the EMU clocking 72.5%, Germany at 68.6%, France has a stronger 84.3%, the U.K. has an even stronger 94.1%. Japan’s service sector is below its median at a 41.2 percentile. The U.S. logs an 86.3 percentile standing.
A narrow range houses most estimates Despite considerable country differences, the average composite reading for EMU members and Japan is 69.4%, the average manufacturing rating is 70.6%, and the average services reading is 72.2%. These standings are all clustered in the upper midrange (low 70th percentile for the most part) indicating overall firm conditions. However, as the table shows there are some clear differences among members. And in comparison, all the U.S. ranks are in their 80th percentile.
Month-to-month and three-month patterns for unaveraged PMI diffusion indexes The month-to-month changes are concentrated with declines in Europe, and some rebound in the U.S. and Japan. Still, Japan tends to lag the PMI levels achieved in Europe (except for manufacturing). Over three months, composite conditions improve everywhere except Japan. All show a weaker manufacturing sector except France that is unchanged and the U.S. that shows an increase. The service sector advances everywhere over three months except in Japan.
Japan is the weakest On theses timelines, only Japan post PMI readings below 50. Its composite PMI for March is 49.3, and its service sector PMI is 48.7. Japan’s composite and service sector PMIs are below 50 in March, February and January, showing outright declines in activity for these sectors in each month. In addition, Japan’s composite PMI averages a below 50 PMI reading over three months and 12 months while services show and average reading below 50 on all horizons, three-months, six-months, and 12-months. Still, Japan’s manufacturing sector registers steady expansion. Japan is suffering from the ills in China, its largest trading partner, where growth has slowed and where a zero-Covid policy continues to impede economic activity. The virus has also been an ongoing issue in Japan that has impacted services.
 United Kingdom| Mar 23 2022
U.K. CPIH Flares...But Slows
Inflation in the U.K. continues to run hot in February. The headline gauge CPIH rose 0.5% in February, the same as in January and in December. Sequential inflation rates for the U.K. show a 5.5% annual rate over 12 months, a 6.5% annual rate over six months, and a 6.2% annual rate over three months. Inflation shows signs of having peaked. These are early signs, preliminary, tentative signs, not irreversible, but encouraging.
Core Inflation- a more complicated pattern The core measure, which is the CPIH excluding energy, food, alcohol beverages & tobacco, decelerated in February rising by 0.4% after gaining 0.6% in January and 0.3% in December. This core measure is up at a 4.5% pace over 12 months; it accelerates to 5.2% over six months; it edges higher to a 5.4% pace over three months. However, a plot of the three-month inflation rates for the core shows that inflation ticked off its highest pace of this cycle slowing in February compared to January (5.8% in January). However, that's only a one-month to deceleration, certainly not definitive.
Inflation fighting complications from the virus ...again The Bank of England has begun to move to fight inflation. Like other central banks, it's concerned that inflation is high and has spread. However, the U.K., like much of Europe right now, is undergoing a resurgence of the virus. This new variant is very highly transmissible; it strikes Europe when countries in Europe are taking off their restraints. WHO claims that the constraints are being taken off too rapidly; it even uses the word ‘brutally’ to describe the policy of relaxation. Still, it's hard to tell why the spread has picked up. Restrictions were lifted and the new variant is much more transmissible-so what is responsible? A number of European countries, especially Germany, right now are undergoing sharp increases in their infection rates. This may be something that monetary policy is going to have to take account of even in the face of other challenges.
Breadth of inflation and its rise monthly Among the 10 U.K. CPI categories in February, half of them show acceleration in inflation month-to-month compared to January. In January, five categories out of ten also had showed month-to-month acceleration. The proportion of acceleration in January and February was lower than in December when seven categories showed acceleration month-to-month. However, with five categories accelerating out of 10 monthly, the breadth of inflation is meeting some resistance to spreading.
Sequential trends Turning to sequential growth rates, over three months only five categories show acceleration compared to six over six months. Over 12 months nine categories accelerated compared to 12-months ago. Over six months the breadth is still substantial with only a few categories resisting acceleration. It is not surprisingly that the 12-month inflation rate is substantially and widely higher across all commodity categories compared to 12-months ago. But over three months the mix of accelerating and decelerating is at the point of neutrality: five accelerate and five decelerate.
The outlook The challenge for the future is going to involve dealing with this inflation spike, with higher global commodity prices, with rising oil prices, with the distortions caused by the war in Ukraine, with various sanctions NATO members and others have adopted, with ongoing problems from the virus, and with supply chain issues. The challenges really are many. For the time being, there is some good news with the three-month inflation rate edging down to 6.2% and the three-month core inflation rate off peak at 5.4% and with it barely having accelerated from six-months ago. But very clearly, inflation still is entrenched. The monthly increase at 0.5% for the headline and 0.4% for the core is too high. The risks for inflation are still substantial and monetary policy has a lot of different situations to juggle in order to solve the inflation riddle and to keep growth on track.
- of102Go to 80 page