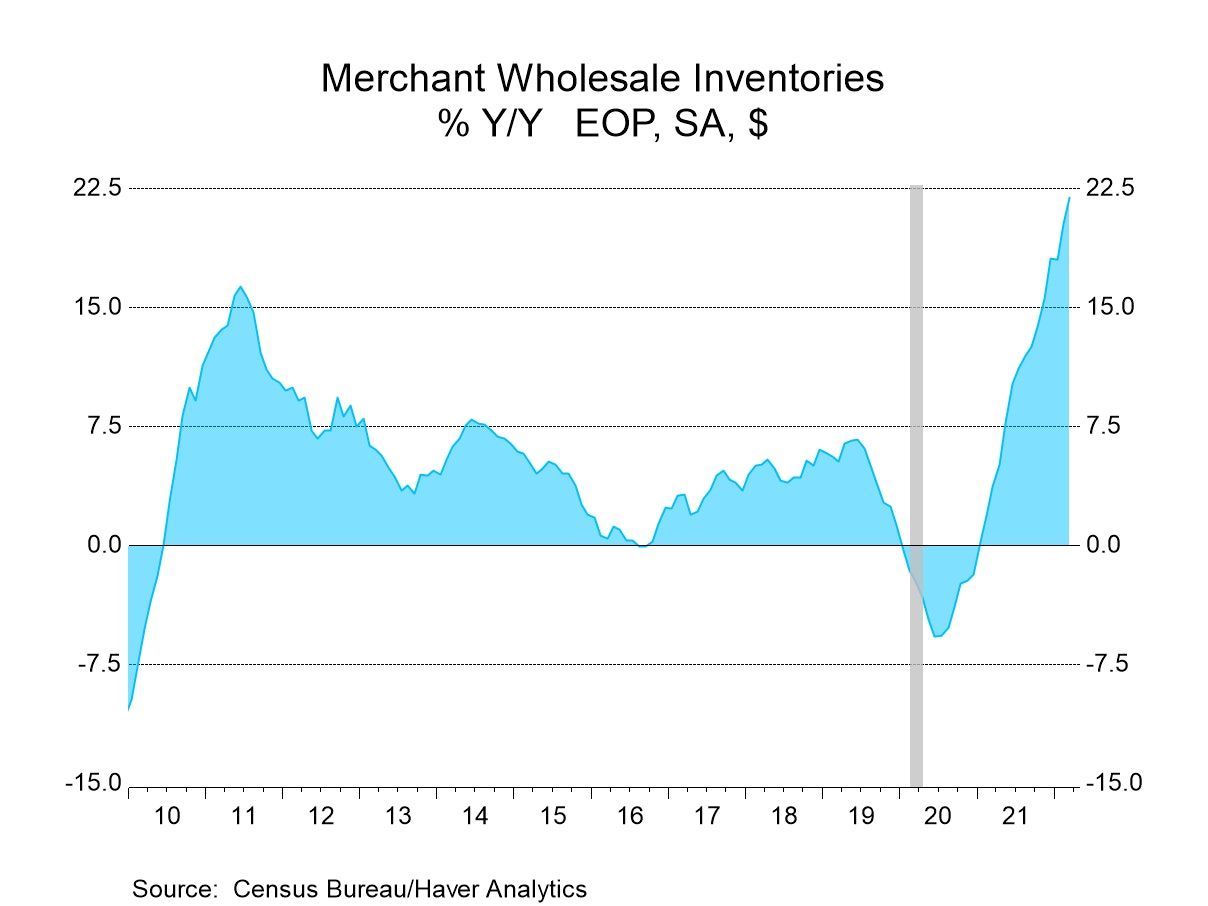
- Strong increases are registered broadly.
- Widespread sales gains also are registered.
- Inventory-to-sales ratio steadies.
 USA| May 09 2022
U.S. Wholesale Inventories Post Strong Gain in March
by:Tom Moeller
|in:Economy in Brief
 France| May 09 2022
French Trade Deficit Deepens As Exports Slow
The French trade deficit slipped deeper into the red ink zone in March at €14.4 billion compared to €12.5 billion in February. The deficit has eroded gradually over the year with a 12-month average of €10.3 billion, a six-month average of €12.2 billion and a three-month average of €12.5 billion. These numbers compare to a trade deficit of €7.9 billion over the previous twelve months- a clear on-going deterioration as the chart documents.
French exports in March fell by 0.1% after falling by 3.6% in February; these compared to imports that rose by 3.4% in March after rising by 0.5% in February. Clearly trade flows are working in the past couple of months to make the deficit larger.
Sequential growth rates show more stability for exports than for imports. But that's little solace since the export growth rates are below the growth rates for imports even though the import growth rates are decaying somewhat.
Exports grow at a pace of 14.3% over three months, 15.7% over six months and 15.1% over 12 months. These are growth rates annualized over the various periods. They compare to imports where the three-month growth rate is 19.2% which is down from 39.7% over six months and lower than the 26.5% pace over 12 months. But clearly, over each of these horizons, imports are growing faster than exports and therefore each of the horizons shows pressure on the trade deficit to get larger.
Export details for France show that food, beverages & tobacco exports have been accelerating slightly from 12.6% over 12 months up to a 25.6% pace over three months. However, transportation equipment exports that fell by 0.1% over 12 months is falling at a 13.1% pace over three months. For other exports, the growth rate is hardly changed, sitting at 19.4% over 12 months and then logging a pace of 19.7% over three months.
For imports, food, beverages & tobacco imports rise by 15.4% over 12 months and by 12.2% over three months. Transportation equipment show imports falling by 0.4% over 12 months and then falling at a much more rapid 29.1% pace over three months. For other imports, the 12-month pace is 33.2%, nearly the same as the 30.7% pace over three months.
 Germany| May 06 2022
German IP Drops...and Leads Europe Lower?
German industrial production fell 3.9% in March. There were declines in all three manufacturing sectors: consumer goods output fell by 1.5%, capital goods fell by a large 6.6%, while intermediate goods output fell by 3.8%. Construction output bucked the trend, rising by 0.9% in March.
These declines followed February where two of three manufacturing sectors advanced and January where all three manufacturing sectors advanced. Construction output has increased in each of the last three months: January, February and March.
Sequential growth rates raise more questions than they determine reliable trends. Consumer goods output is an exception to this with output rising at a 5.2% pace over 12 months, accelerating to a 10.6% pace over six months, and accelerating further to a 19.9% annual rate over three months. Intermediate goods decline on each of these same horizons, but the declines are not clear decelerations. Intermediate good output has a 3.5% decline over 12 months; that's reduced to a 1.2% pace of contraction over six months and then there is a clear step-up in the pace of decline to an annualized 10.5% pace over three months. Similarly, capital goods output trends generally show deterioration and deteriorating patterns but have a break in the wrong direction over six months. Capital goods output falls by 8.2% over 12 months and then posts a small 0.5% rate of increase over six months and goes on to log a large 29% annual rate of decline over three months.
Each of the manufacturing sectors seems to have its own trend or trajectory underway; however, these do not combine for any sense of a clear picture for manufacturing overall. Construction on the other hand shows acceleration as output falls by 0.6% over 12 months, rises at a 10.7% pace over six months then accelerates to a 30.2% annual rate over three months. Still, we are not left with a clear picture of where German production is headed.
Other horizons In the quarter-to-date (now the completed first quarter), German output shows increases in all sectors except capital goods where there's a 5.4% annual rate of decline. Consumer goods output spurts at a 19.1% annual rate and intermediate goods output increases at a 2.7% annual rate; in construction output rises at 18.5% annual rate.
Looking at these sectors since January 2020 when the virus struck, total output, capital goods output, and intermediate good output are all lower than they were in January 2020. However, consumer goods output is 3.7% higher and the output of construction it's up by 1.8% on that two-year plus timeline.
Orders and sales In March manufacturing output fell by 4.6%, real manufacturing orders fell by 4.7%, and real sales in manufacturing fell by 5.9%. These weaknesses add to the weakness in industrial production overall and point to problems with orders and demand quite apart from output. Over three months real manufacturing orders are showing clear deceleration as they fall by 3% over 12 months, fall at a 7.5% rate over six months, and then accelerate that decline, falling 12.6% at an annual rate over three months. Real sector sales make a familiar detour to slightly stronger numbers over six months; otherwise they also trace a weakening pulse. Real sector sales for manufacturing fall by 6.2% over 12 months, rise at a 2.4% annual rate over six months and then decline at a sharp 23.7% annual rate over three months.
Germany, among European countries, has been very locked into the Russian economy not only for its energy but also for commerce and with the sanctions put in place and the war going on between Russia and Ukraine, it's not surprising that the German economy is doing poorly; its orders are falling quite sharply, and sales are weak or consistently pulling back.
Industrial indicators Industrial indicators from ZEW, the IFO manufacturing survey, IFO manufacturing expectations and from the EU Commission industrial indexes all show weaker conditions in March than in February across the board. Sequential readings typically show greater weakness over shorter periods; however, the EU Commission indexes are remarkable for their stability. There is little-change in the EU Commission indexes when we look at its average levels over three months, six months and 12 months; however, we know that in March there is in this one month a substantial deviation and drop from previous averages,
Other Europe Turning to the industrial situation in other Europe, we have three European Monetary Union (EMU) members in France, Spain, and Portugal reporting early and then we have EU member Sweden reporting as well. Among these countries in March, only France shows output declines. Spain, Portugal, and Sweden show increases in output. Looking at their sequential results, output in France is accelerating from 12 months to six months to three months. The same pattern holds for Spain. Portugal starts out with some acceleration but then conditions fall off over three months with output declining at a 0.8% annual rate. Sweden also starts off with accelerating trend; it fails to produce stronger growth over three months compared to six months although it does produce another positive growth number.
 USA| May 06 2022
Another Record Monthly Increase in U.S. Consumer Credit
- Led by record increase in revolving credit balances.
- Rise in nonrevolving credit usage slowed slightly.
by:Sandy Batten
|in:Economy in Brief
 USA| May 05 2022
U.S. Unemployment Claims Increased in Latest Week
- Initial claims rose 19,000 to 200,000.
- Continued weeks claimed fell further to lowest since January 1970.
- Insured unemployment rate retained record low of 1.0%.
by:Sandy Batten
|in:Economy in Brief
 USA| May 05 2022
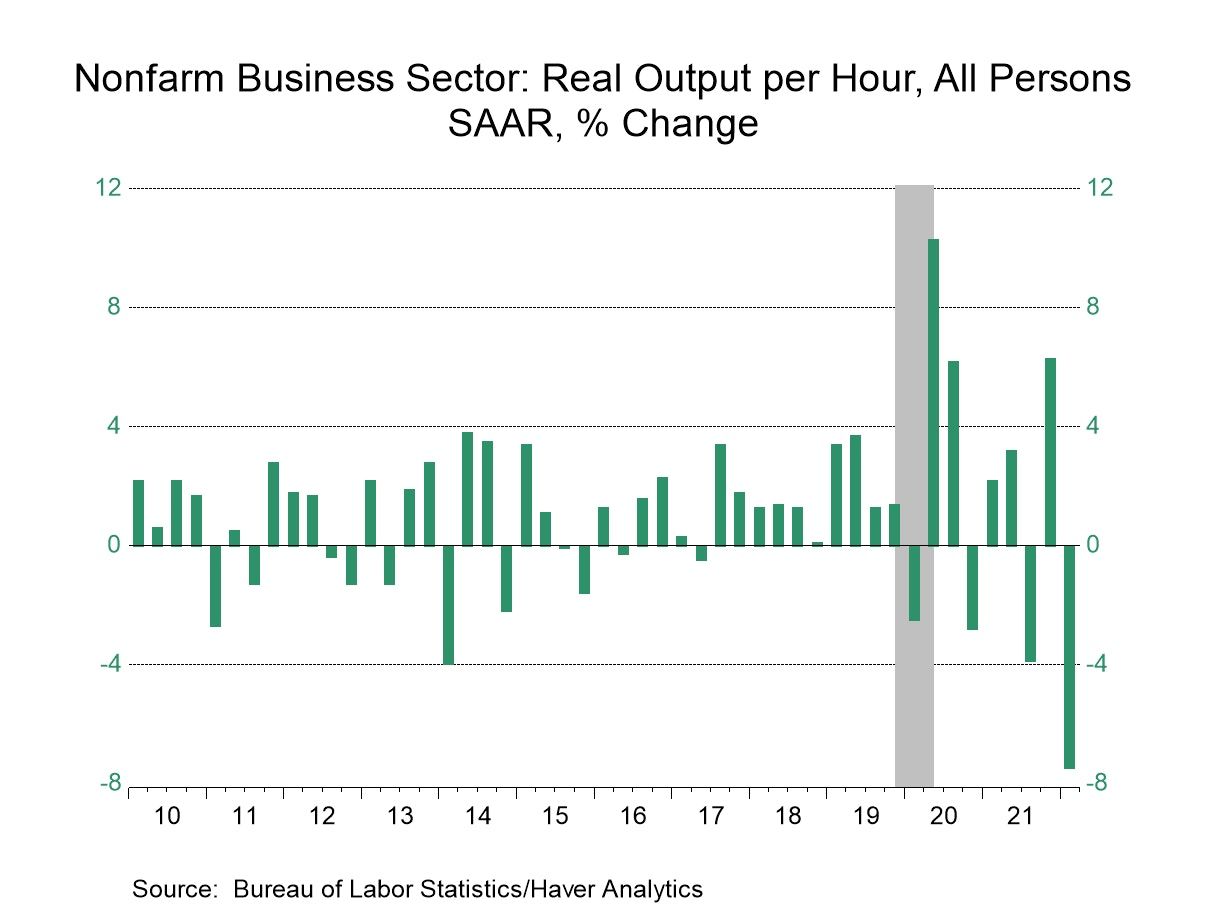
U.S. Productivity Declines and Drives Labor Costs Higher in Q1
- Productivity drop is greater-than-expected.
- Compensation gain weakens.
- Unit labor costs surge.
by:Tom Moeller
|in:Economy in Brief

 Global| May 05 2022
Manufacturing PMIs Continue Extended Softening Streak
The S&P Global manufacturing PMIs continue to show slippage for worldwide manufacturing. The chart highlights three main areas: China, the United States, and the euro area. Each of these areas shows consistent slippage from early-2021 onward and for China a bit longer.
The two tables below show manufacturing PMI readings and summary data for 18 countries in April. Half of them show worsening in April and half of them show improvement. This is an improvement from March when 12 showed month-to-month weakening; it compares to February when seven showed month-to-month weakening. Those statistics mark this as a period of unevenness tending to weakness.
Over three months compared to six months, 12 members in Table 1 show weaker results. Over six months compared to 12 months, 11 members in this table show weaker results. However over 12 months compared to 12 months ago, only 5 show weaker conditions. These five are China, Brazil, Malaysia, Vietnam, and Turkey, a selection of developing economies.
There are 7 reporters and the table with manufacturing percentile standings (cast form data back to January 2018) that are below their medians; these are identified by any queue standings that reside below their 50% mark. Countries in this situation include Germany, China, Russia, Brazil, Taiwan, Vietnam, and Turkey. Countries with queue percentile standings high in their respective ranges are led by Malaysia with a 90.4 percentile standing, followed by the U.S. with an 86.5 percentile standing and Japan with 82.7 percentile standing.
Table 1 also evaluates manufacturing sectors for their strength since COVID hit. The final column of the table shows the change in manufacturing PMIs from January 2020. On this timeline, Germany and the euro area had the two strongest gains, followed by the U.S., the U.K., and Canada that also have relatively strong gains. However, there are still four countries in the table that show net declines on this timeline. China leads them, with a decline of 5 points, Turkey with a decline of 2.1 points and declines by manufacturing in India and Taiwan.
The 18 countries in the table show the queue percentile standings average 58.9 percentile which is a reasonably firm but not a particularly strong reading. If we position them on this timeline between their respective high and low values, they stand relatively higher in their range than in their queues with a 74.3 percentile standing on average.
 USA| May 04 2022
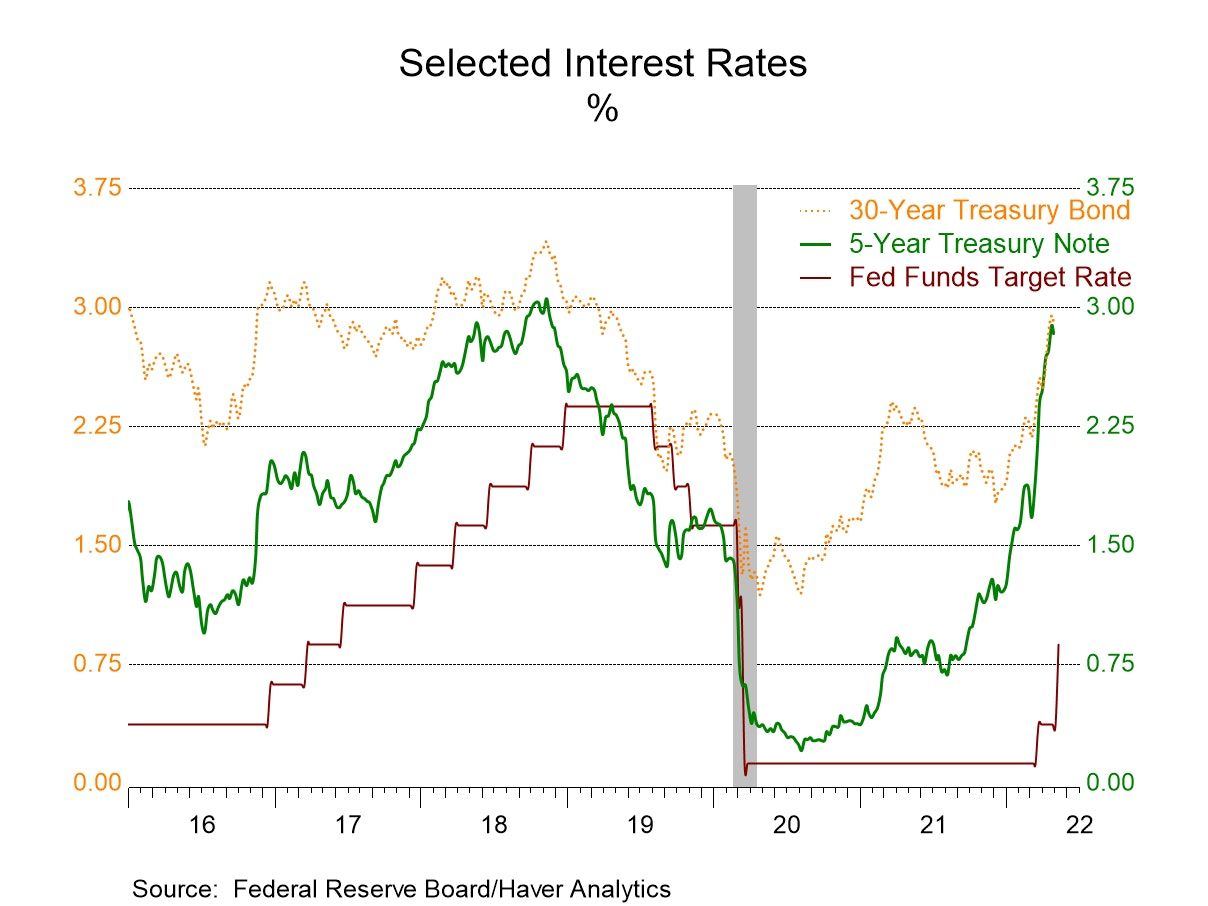
FOMC Lifts Funds Rate Target by Half Point as Expected
At today's meeting of the Federal Open Market Committee (FOMC), the Fed announced that it will raise the target for the Federal funds rate to a range of 0.75% - 1.00% from 0.25% - 0.50%. It placed the rate at the highest level since March 2020. The move was as expected in the Action Economics Forecast Survey.
The Fed also "anticipates that ongoing increases in the target range will be appropriate."
The statement indicated that, "Although overall economic activity edged down in the first quarter, household spending and business fixed investment remained strong. Job gains have been robust in recent months, and the unemployment rate has declined substantially. Inflation remains elevated, reflecting supply and demand imbalances related to the pandemic, higher energy prices, and broader price pressures."
It also stated, "The invasion of Ukraine by Russia is causing tremendous human and economic hardship. The implications for the U.S. economy are highly uncertain. The invasion and related events are creating additional upward pressure on inflation and are likely to weigh on economic activity. In addition, COVID-related lockdowns in China are likely to exacerbate supply chain disruptions. The Committee is highly attentive to inflation risks."
In addition, the Fed will begin reducing its $9 trillion portfolio of Treasury securities and agency debt and agency mortgage-backed securities on June 1.
Today's action was endorsed by each member of the FOMC.
The statement issued following today's meeting can be found here.
by:Tom Moeller
|in:Economy in Brief
- of102Go to 68 page