U.S. Wholesale Inventories Post Strong Gain in March
by:Tom Moeller
|in:Economy in Brief
Summary
- Strong increases are registered broadly.
- Widespread sales gains also are registered.
- Inventory-to-sales ratio steadies.
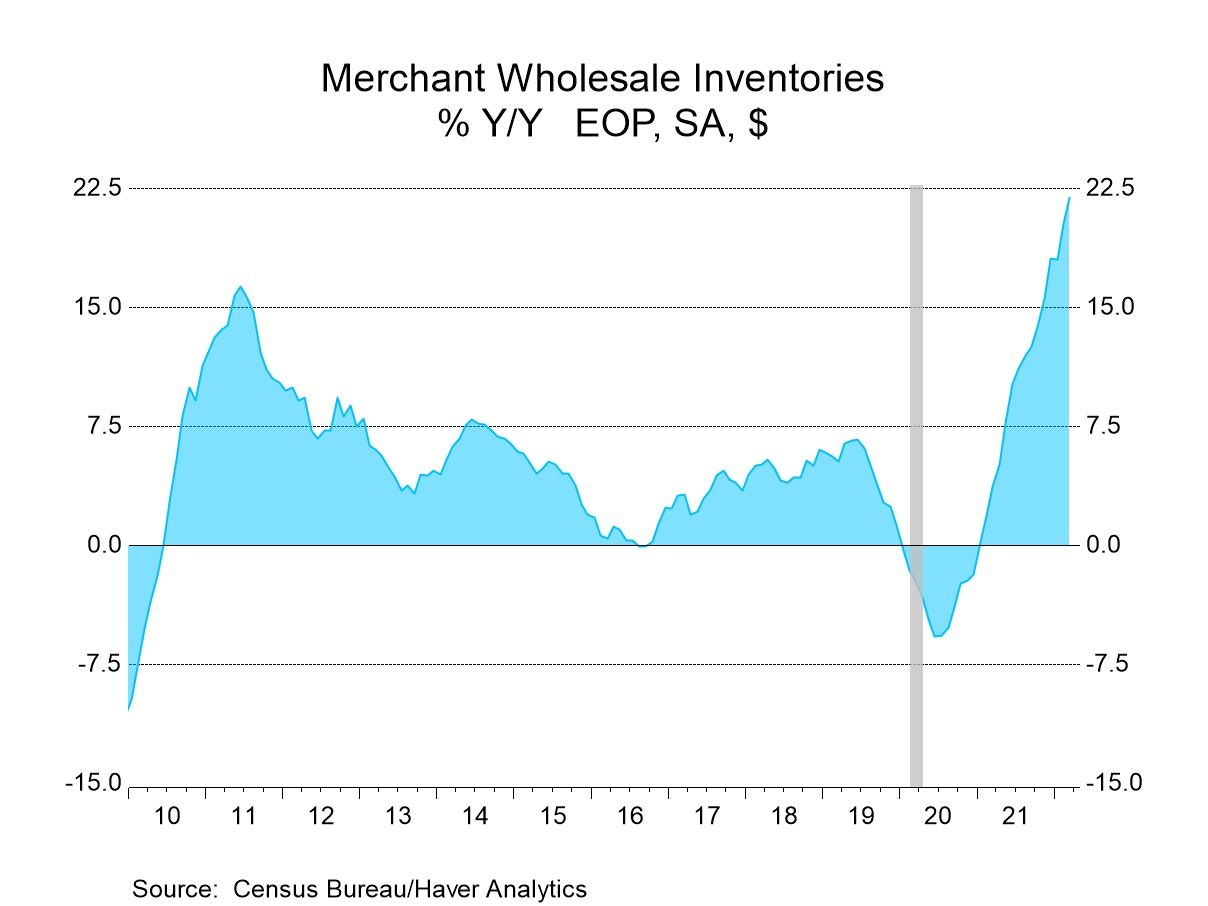
Wholesale inventories during March increased 2.3% (22.0% y/y) compared to a 2.8% rise in the advance report issued on April 27. The gain followed a 2.8% February rise, revised from 2.3% reported earlier. Wholesale inventories account for roughly one-third of total business inventories. The Informa Global Markets Survey expected a 2.3% March gain.
Durable goods inventories increased 2.2% in March (23.2% y/y), the same as in February. Furniture & home furnishings inventories led the gain and jumped 4.5% (43.4% y/y). Electrical equipment inventories surged 4.2% (31.9% y/y) while motor vehicle & parts inventories increased 2.4% (14.0% y/y). Machinery inventories gained 1.7% (10.0% y/y) while professional equipment inventories increased 1.4% (16.0% y/y).
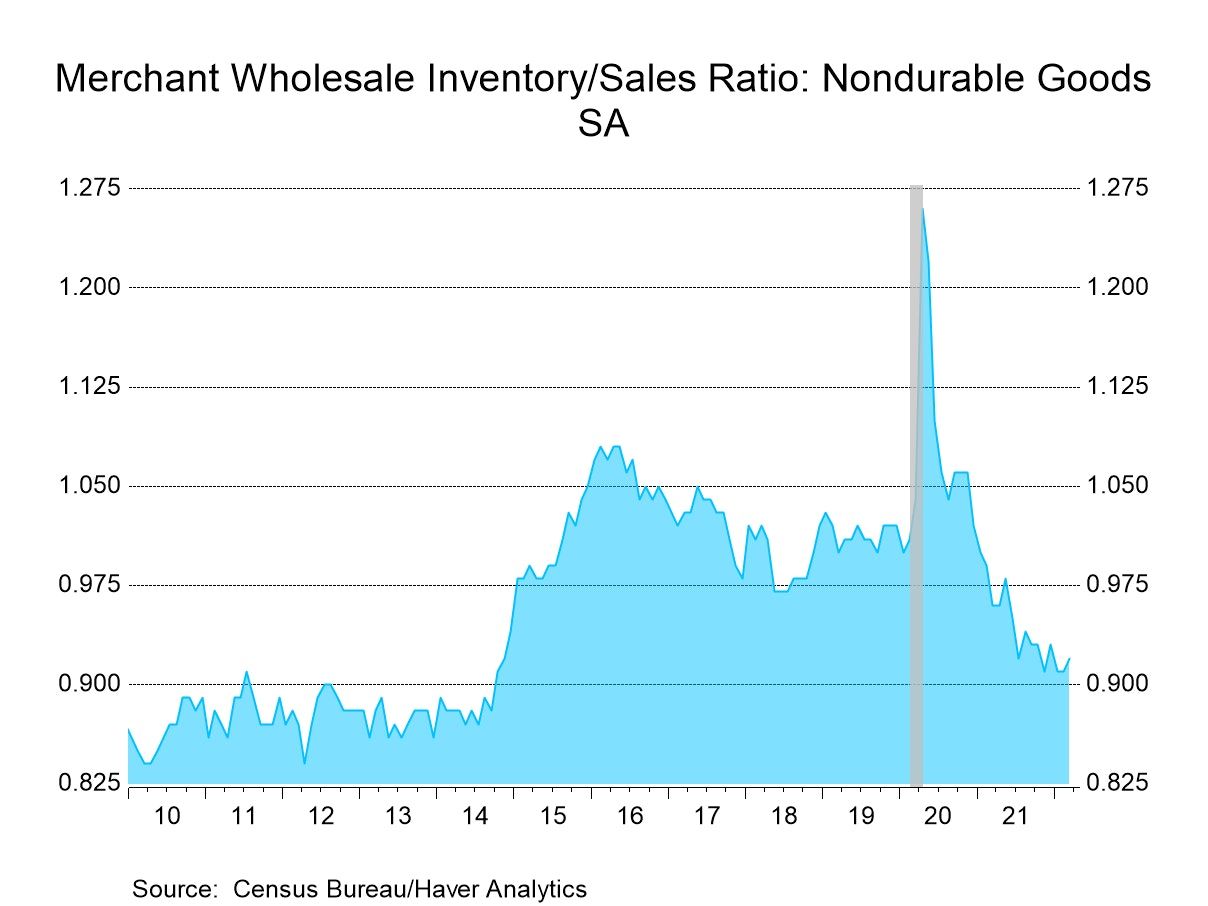
In the nondurable goods sector, inventories rose 2.6% (20.2% y/y) after strengthening 3.8% in February. Apparel inventories jumped 4.4% (28.5% y/y) while the value of chemicals inventories rose 2.9% (24.0% y/y). A 1.5% increase (21.1% y/y) in inventories of petroleum & petroleum products followed but paper & paper product inventories edged 0.4% lower (+7.8% y/y).
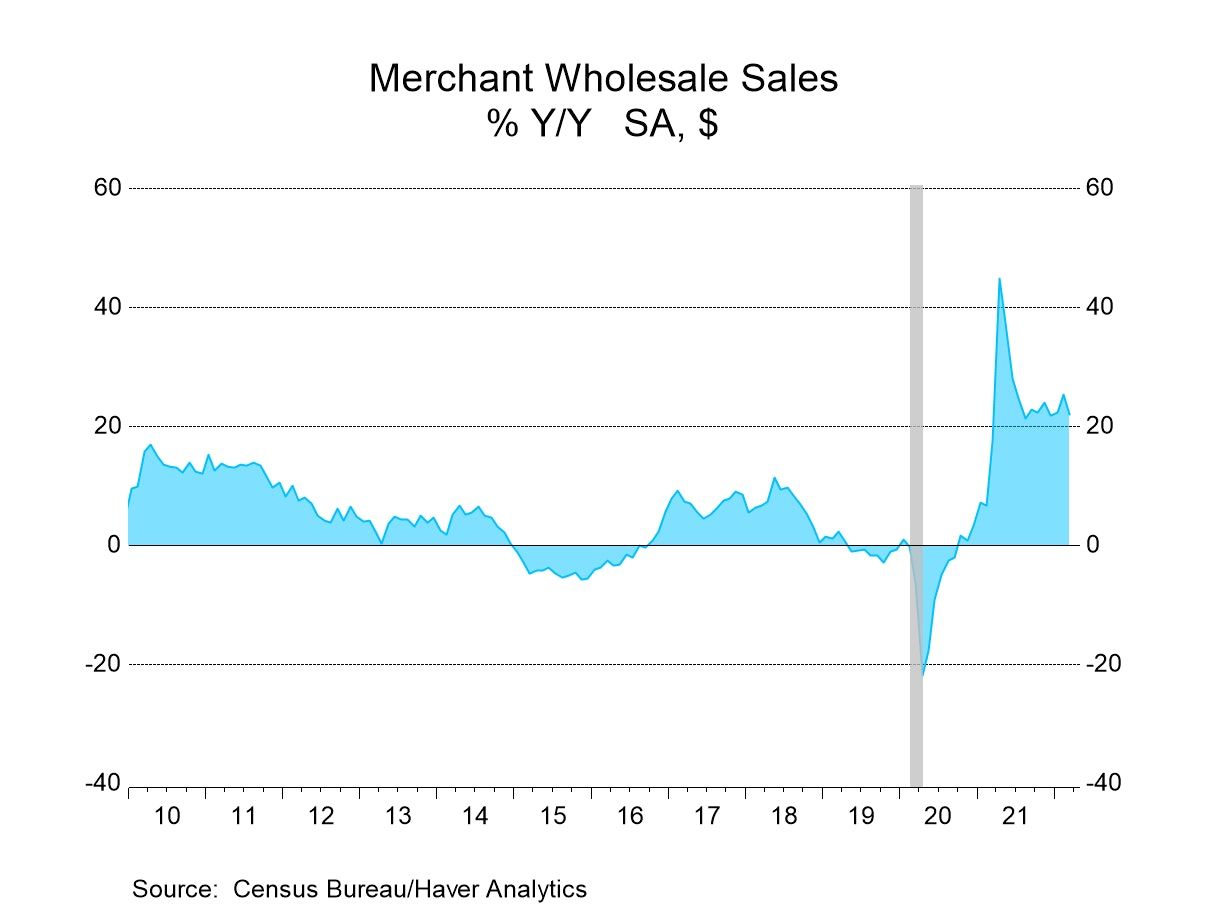
Wholesale sales increased 1.7% in March (22.1% y/y) after strengthening 1.5% in February. A 1.7% rise was anticipated in the Action Economics Forecast Survey. Durable goods sales improved 1.7% (18.1% y/y) after falling 1.0% in February. Purchases of motor vehicles strengthened 3.9% (6.8% y/y) while lumber sales increased 3.8% (32.3% y/y). Home furnishings purchases increased 2.3% (18.3% y/y) and metals sales rose 2.9% (43.3% y/y). Electrical equipment sales improved 0.5% (19.1% y/y) while machinery sales held steady (17.8% y/y).
Sales of nondurable goods gained 1.6% (25.9% y/y) in March following a 3.9% surge in February. Sales of petroleum products jumped 6.9% and by two-thirds y/y with higher prices. Apparel sales strengthened 4.7% (12.7% y/y) and chemical purchases improved 3.3% (26.6% y/y). Sales of paper product rose 1.7% (23.2% y/y) while grocery sales declined 1.3% (+16.8% y/y).
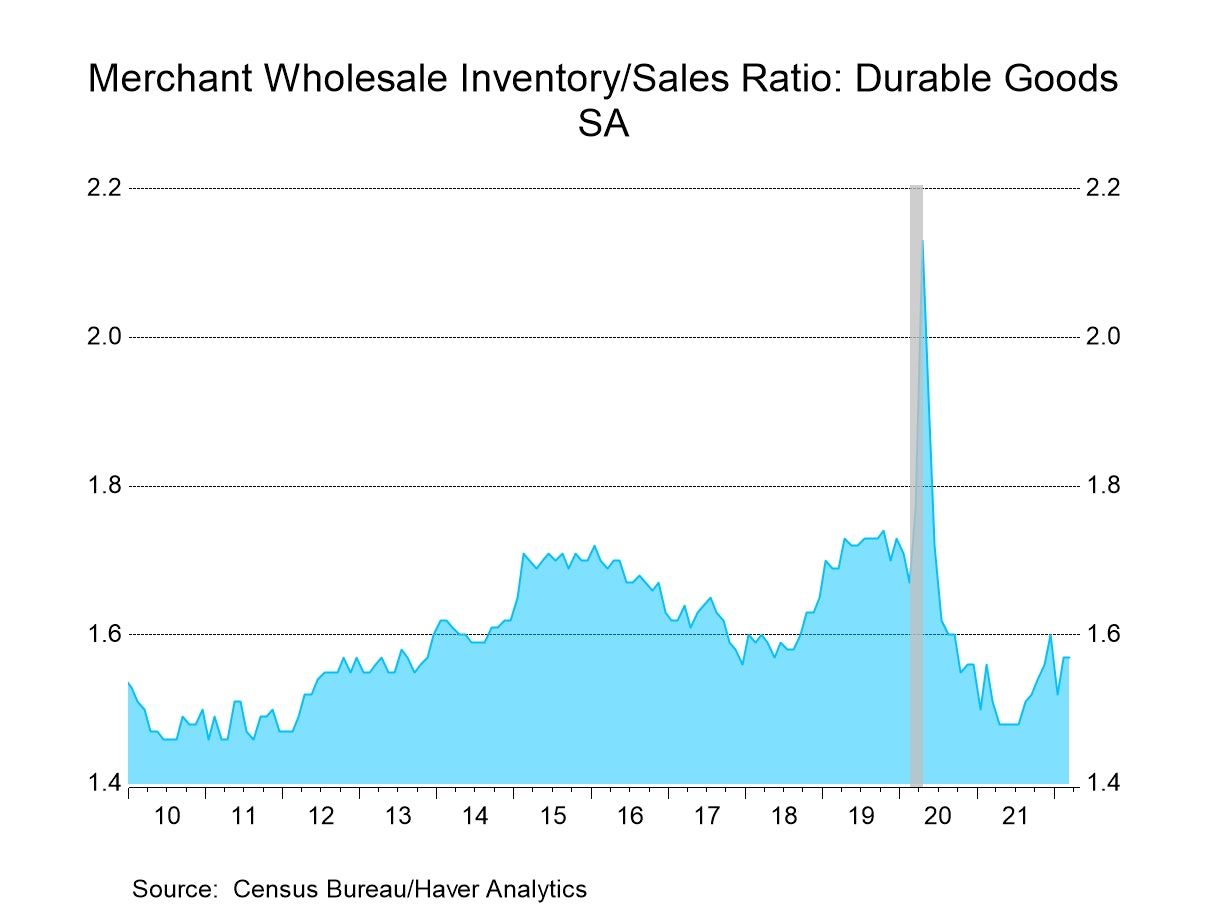
The inventory-to-sales ratio held steady in March at 1.22. The durable goods I/S ratio also remained unchanged at 1.57 and the nondurable I/S ratio edged up to 0.92.
The wholesale trade figures are available in Haver's USECON database. The expectations figure for inventories is contained in the MMSAMER database. Expectations for sales are in the AS1REPNA database.

Tom Moeller
AuthorMore in Author Profile »Prior to joining Haver Analytics in 2000, Mr. Moeller worked as the Economist at Chancellor Capital Management from 1985 to 1999. There, he developed comprehensive economic forecasts and interpreted economic data for equity and fixed income portfolio managers. Also at Chancellor, Mr. Moeller worked as an equity analyst and was responsible for researching and rating companies in the economically sensitive automobile and housing industries for investment in Chancellor’s equity portfolio. Prior to joining Chancellor, Mr. Moeller was an Economist at Citibank from 1979 to 1984. He also analyzed pricing behavior in the metals industry for the Council on Wage and Price Stability in Washington, D.C. In 1999, Mr. Moeller received the award for most accurate forecast from the Forecasters' Club of New York. From 1990 to 1992 he was President of the New York Association for Business Economists. Mr. Moeller earned an M.B.A. in Finance from Fordham University, where he graduated in 1987. He holds a Bachelor of Arts in Economics from George Washington University.
More Economy in Brief

 Global
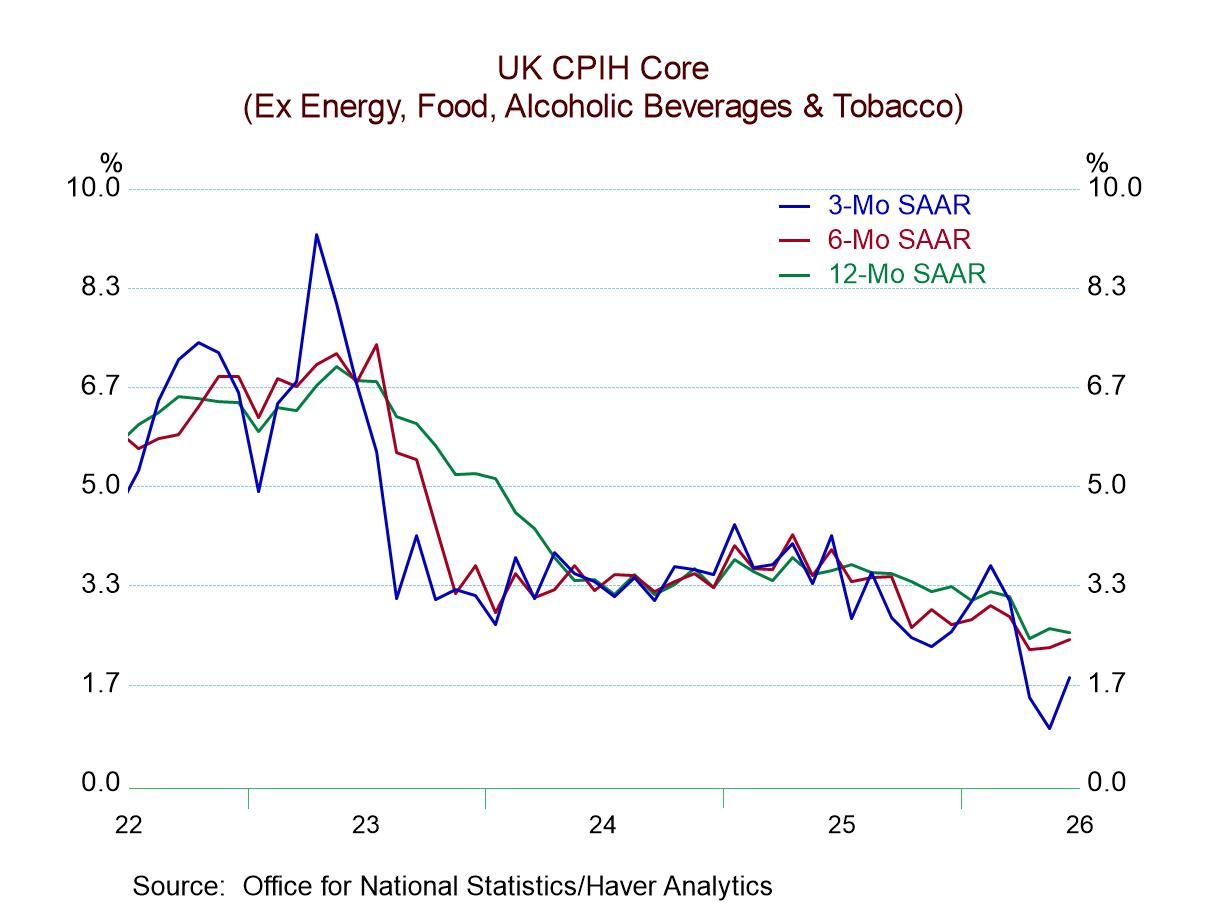
U.K. Headline and Core Inflation Rates Slow Sequentially as BOE Gets Ready to Meet