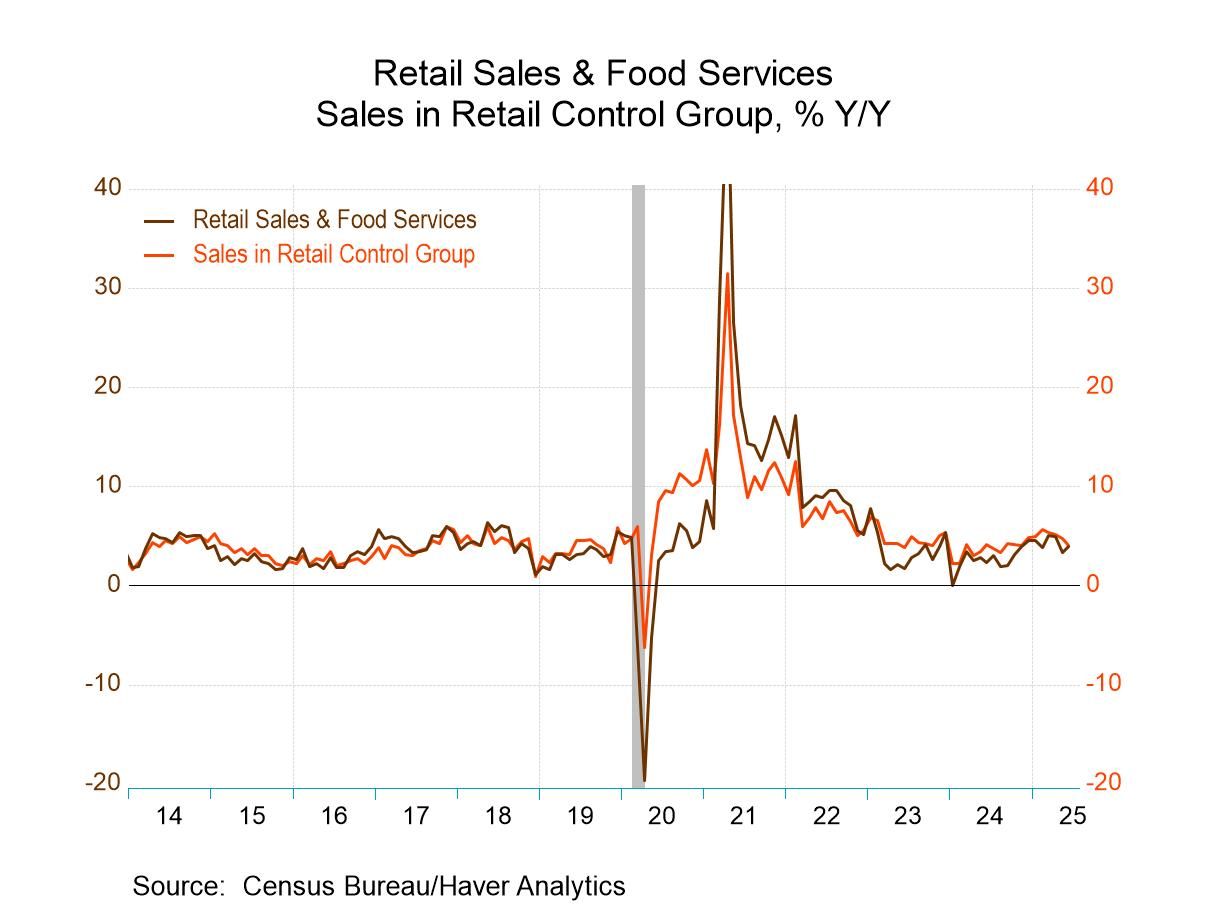
- Increase led by surge in sales excluding autos.
- Nonauto sales also improve.
- Sales in the control group (used to estimate PCE) strengthen.
 USA| Jul 17 2025
U.S. Retail Sales Rebound in June
by:Tom Moeller
|in:Economy in Brief
 USA| Jul 17 2025
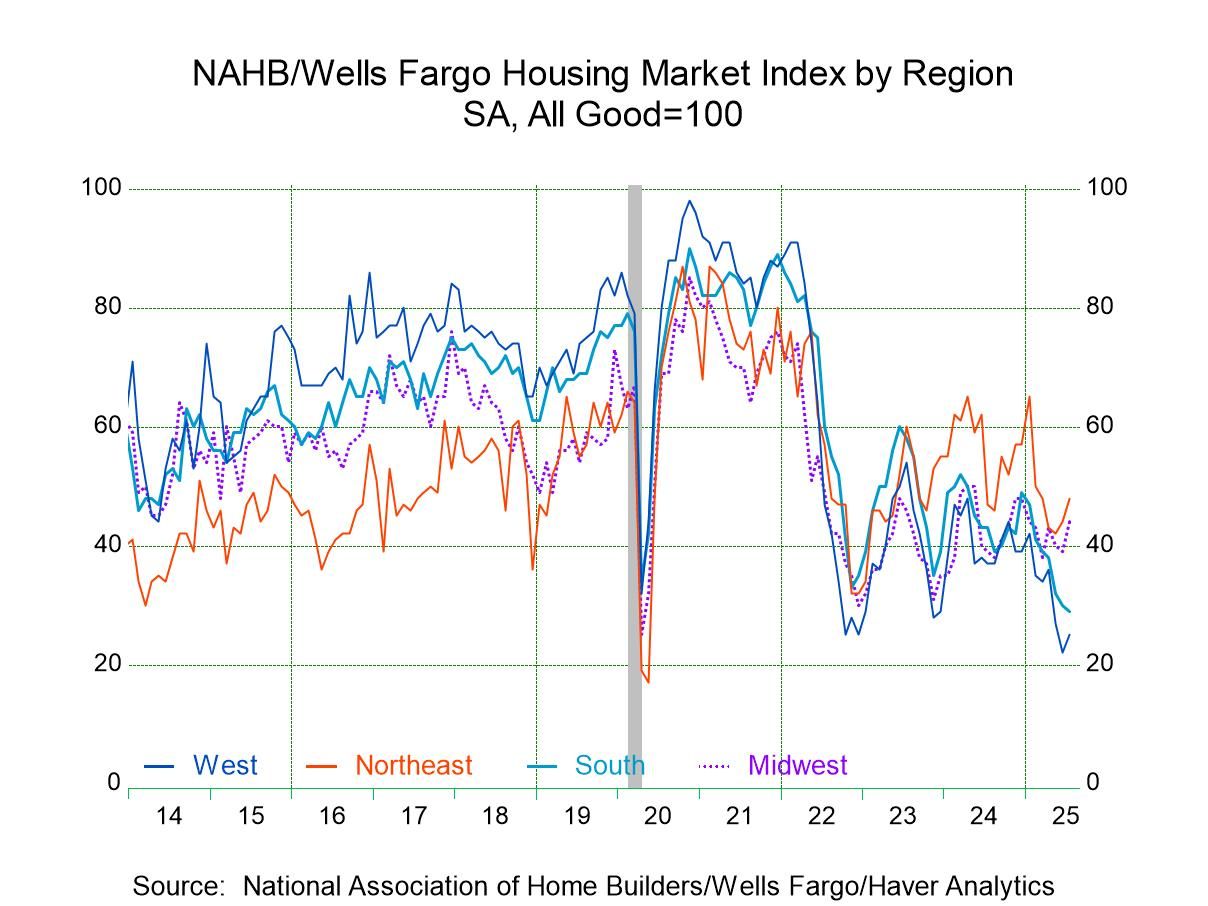
U.S. Home Builder Index Improves in July
- Increase follows two months of decline.
- Two of three components rise.
- Regional indexes are mixed.
by:Tom Moeller
|in:Economy in Brief
 USA| Jul 17 2025
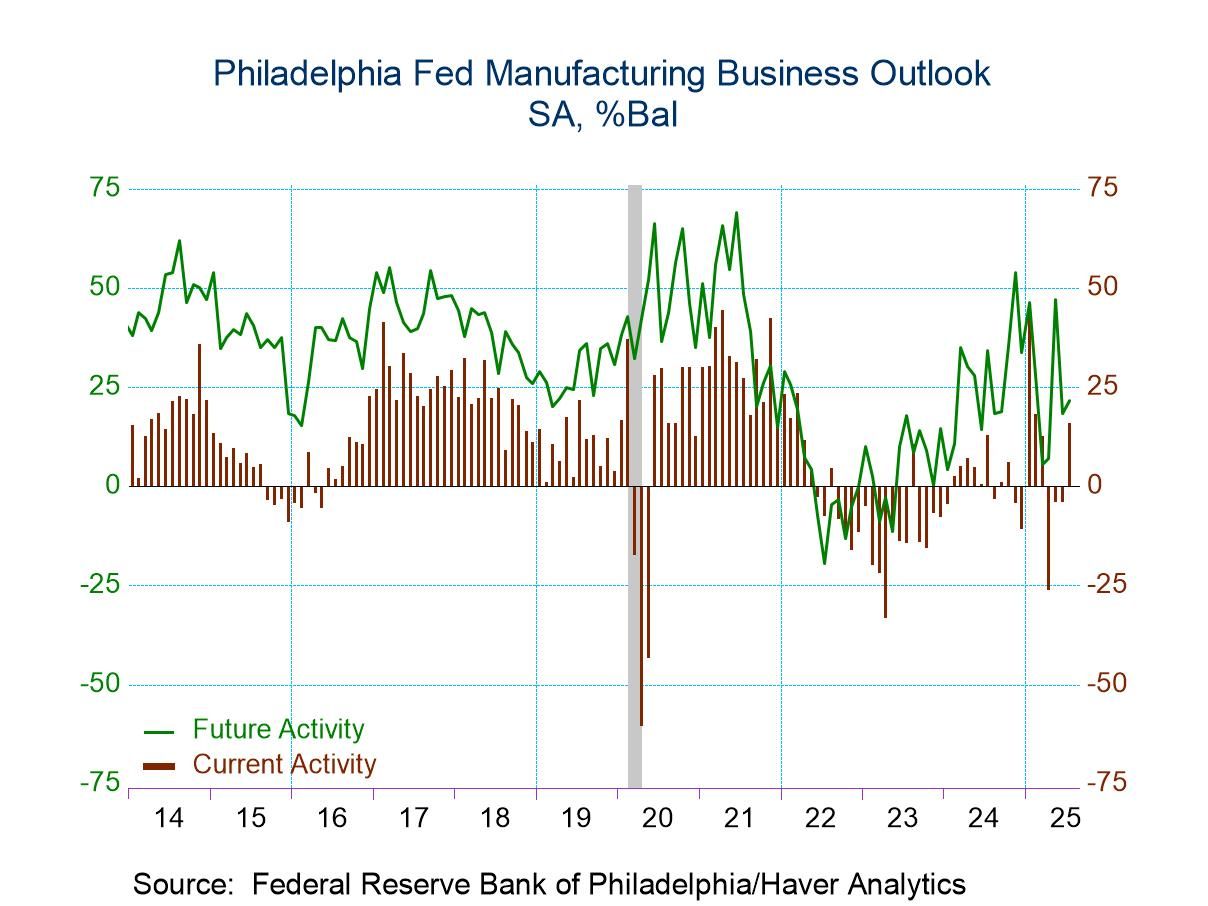
U.S. Philly Fed Manufacturing Index Jumps in July
- The headline index jumped nearly 20 points, led by strong performances by both orders and shipments.
- However, ISM-adjusted composite slipped a bit, indicating that the jump in the headline index was not widely supported by the components.
- Delivery times shortened markedly while both prices paid and prices received indexes posted significant gains.
by:Sandy Batten
|in:Economy in Brief
 USA| Jul 17 2025
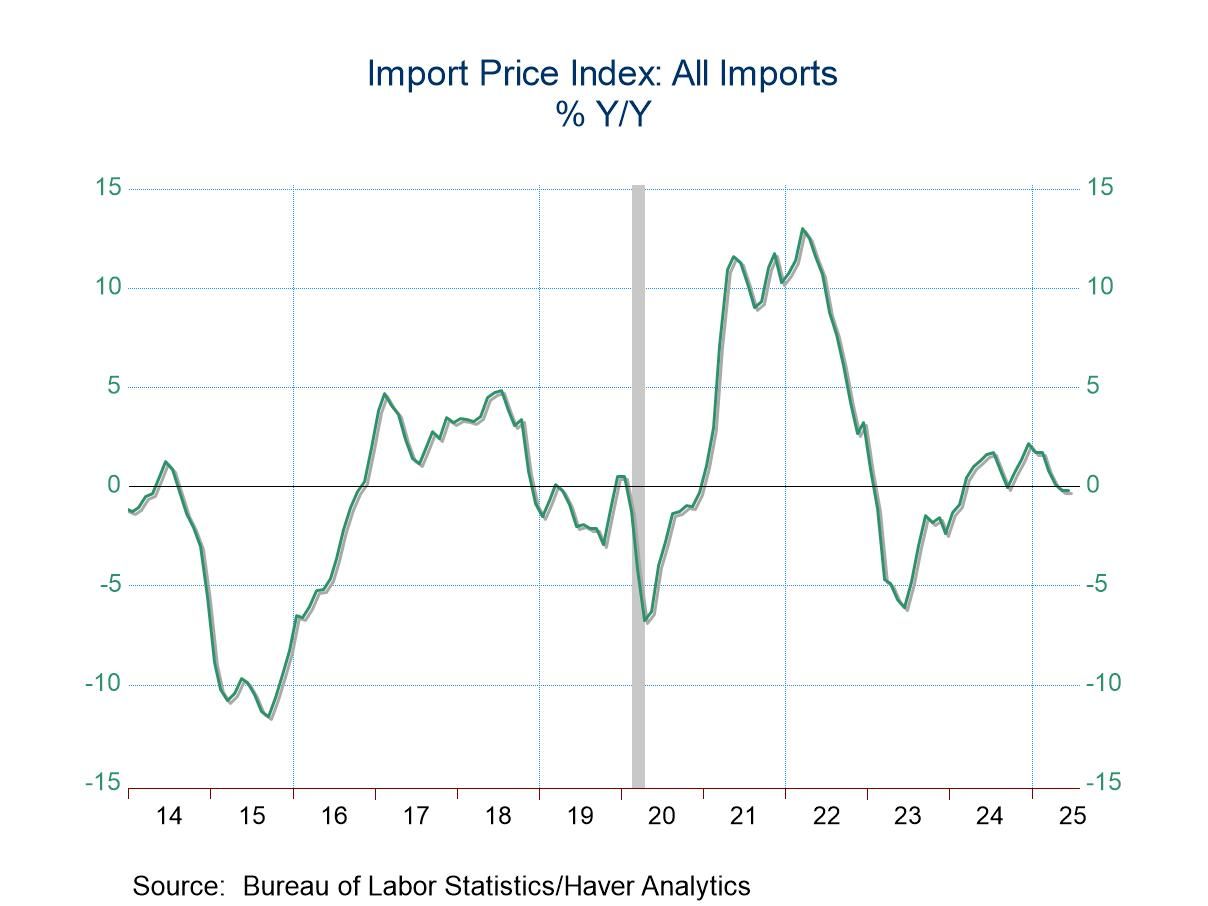
U.S. Import Prices Edged Up and Export Prices Rebounded in June
- Import prices edged up in June from May but fell from a year ago.
- Higher prices for nonfuel imports more than offset lower prices for fuel imports in June.
- Export prices jumped more than expected, nearly reversing May’s decline.
- Prices rose for both agricultural and nonagricultural exports.
by:Sandy Batten
|in:Economy in Brief
 USA| Jul 17 2025
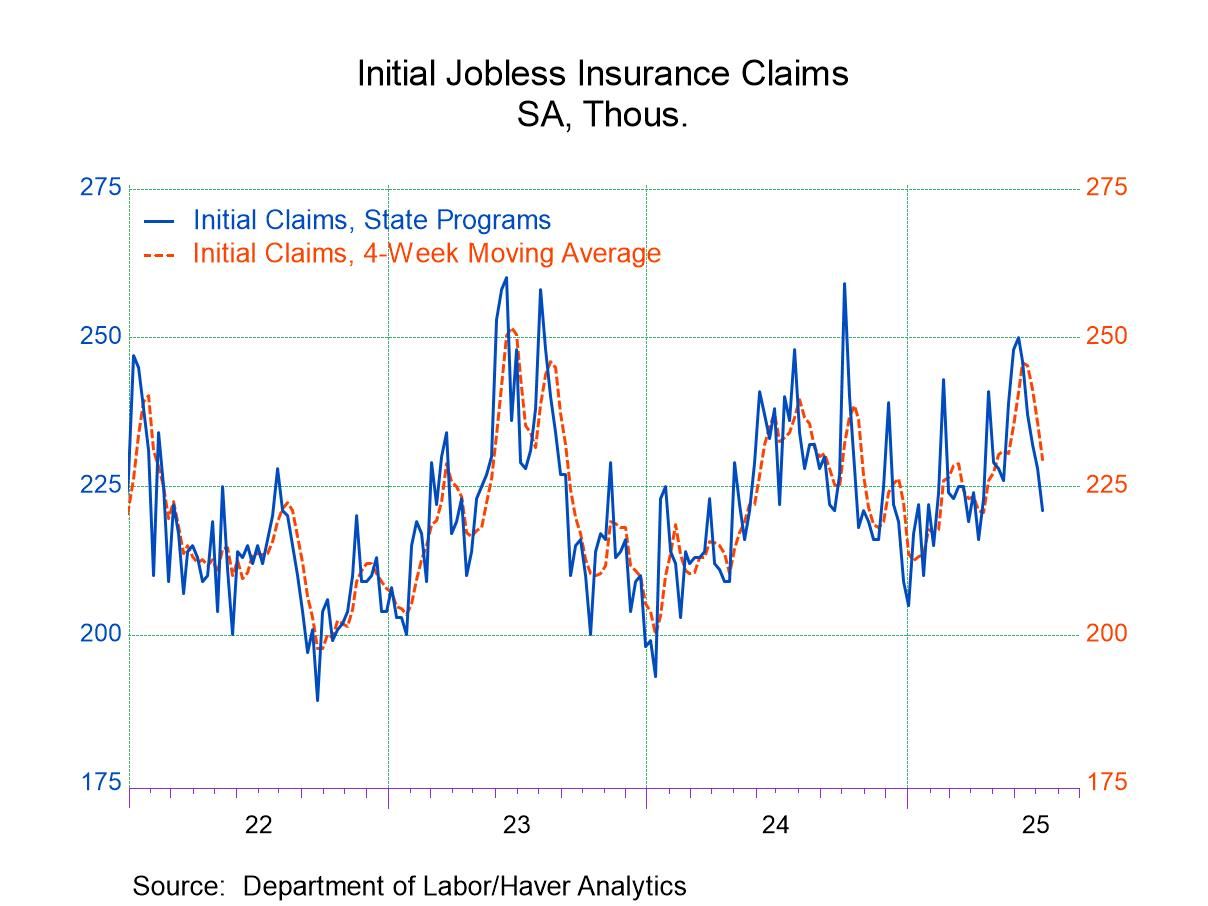
U.S. Initial Unemployment Insurance Claims Fell in Latest Week
- Initial claims have declined for five consecutive weeks.
- Continuing claims rose slightly in the July 5 week.
- Insured unemployment rate was unchanged for the sixth consecutive week.
 Australia| Jul 17 2025
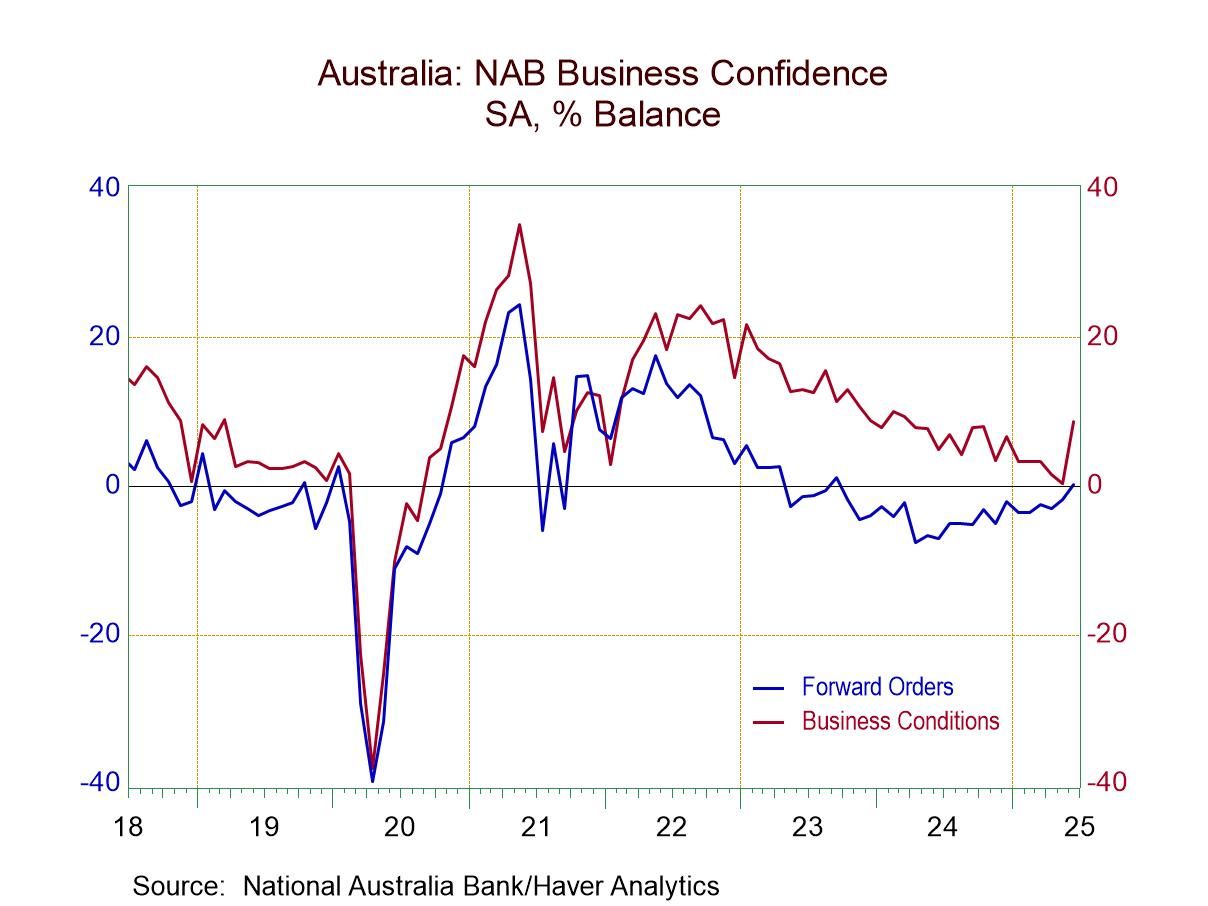
Aussie Business Confidence -National Australia Bank Survey
The National Australia Bank (NAB) survey for June shows a jump in Australia’s business confidence to 5.1 from 2.2 in May and those compared to a reading of -0.7 in April. The sequential averages show a steady improvement from a 12-month average of 0.2 to a six-month average of 1.3 and to a three-month average of 2.2. The monthly May reading is at 2.2. With the June reading moving up to 5.1, it looks like this progression toward improvement remains in train.
Smoothed assessments Smoothing out the monthly data shows that the three-month smoothing operation switches the progression from 12-months to six-months to three-months to reveal improvement that has stalled out. Looking at 12-month averages, there's an improvement over six months compared to 12-months, and then a slight set-back over three months.
Components The components over three months show improvement in train for about half of the categories, compared to 43.8% improving over six months and 25% improving over 12 months. The sense of improvement across categories has been broadening over the more recent periods.
Standings Percentile standings on the data back to 2002 show above-median standings in seven of the thirteen survey categories. Over this period, business confidence itself ranks slightly below its median with a 49.5 percentile standing; the median occurs at a standing of 50-percentile. The index of business confidence is currently close to its median on this, but slightly below it. However, the rankings for the three-month moving average and the 12-month moving average both are considerably lower, indicating that much of the improvement that we see in the Australian index is relatively recent.
Summing up Australia remains caught up in tariff negotiations with the United States along with every other country, a factor that extends uncertainty and could be holding back progress in the economy. However, the current survey suggests that progress is in train, nonetheless.
 USA| Jul 16 2025
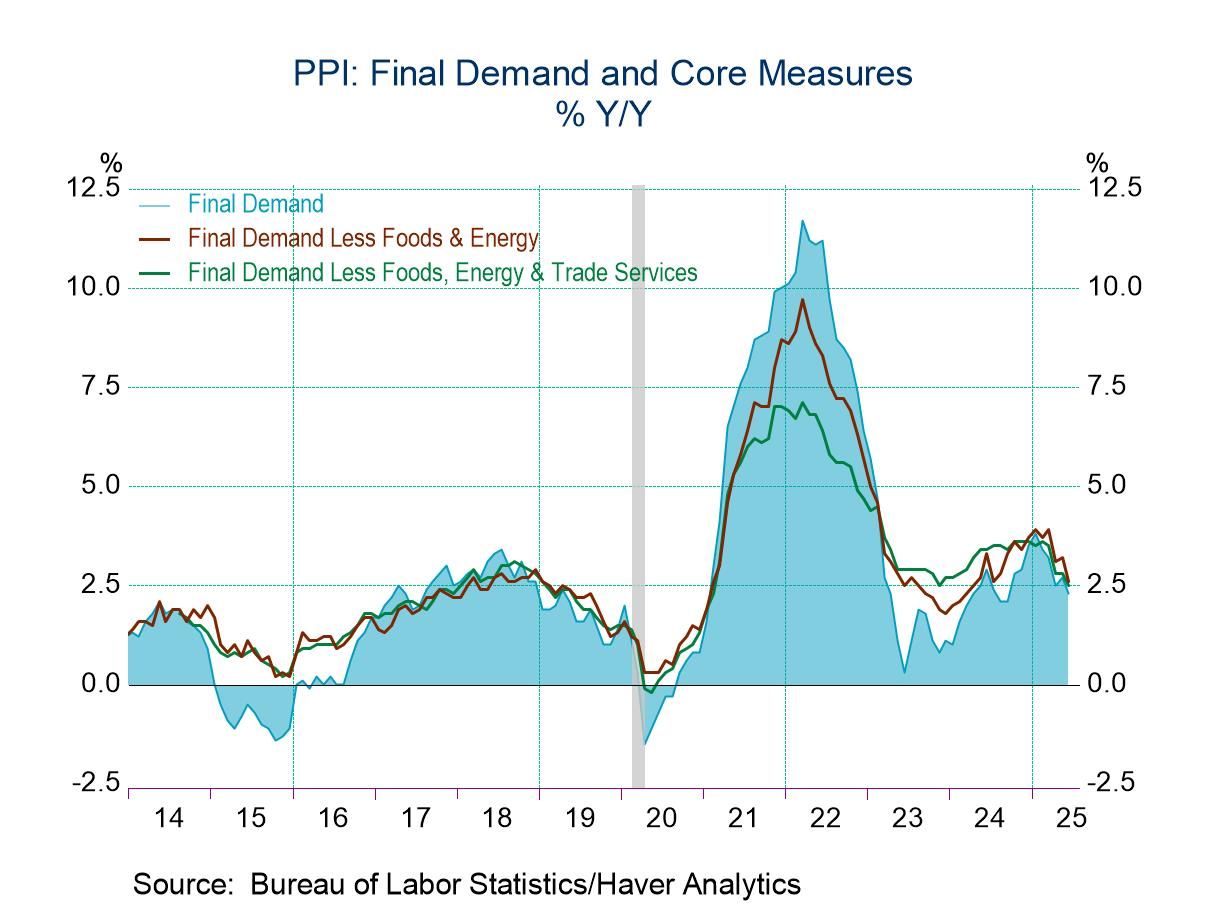
U.S. Producer Price & Core Price Indexes Hold Steady in June
- Unchanged monthly levels extend weakness earlier this year.
- Core price gain slows y/y.
- Final demand price index is steady; services prices decline.
by:Tom Moeller
|in:Economy in Brief
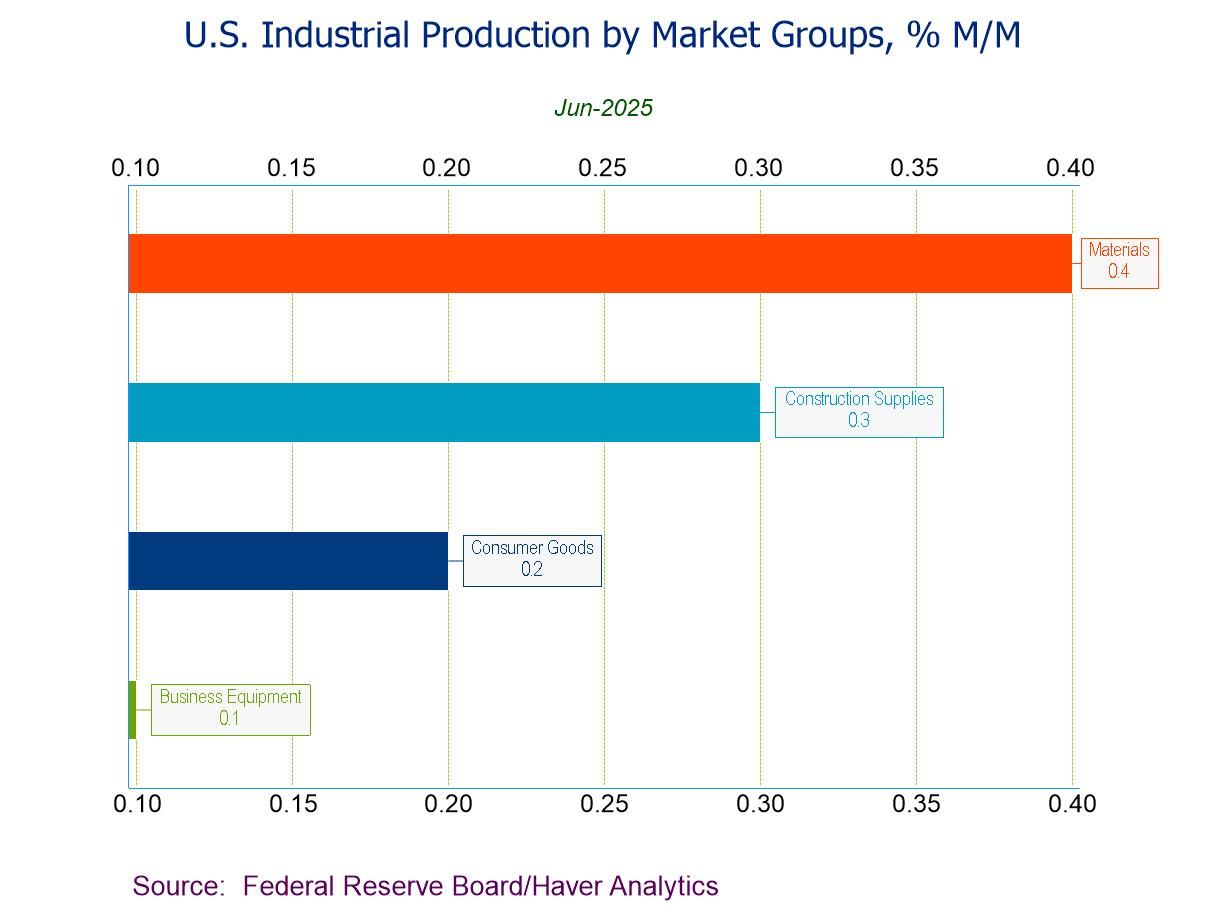
- June IP +0.3% (+0.7% y/y), led by a 2.8% rebound in utilities output.
- June IP Index at the highest level since Dec. ’18.
- Mfg. IP +0.1%, w/ durables unchanged and nondurables up 0.3%.
- Mining activity -0.3%, the second m/m fall in three months.
- Key categories in market groups all increase.
- Capacity utilization up 0.1%pt. to 77.6%; mfg. capacity utilization up 0.1%pt. to a 3-month-high 76.9%.
- of10Go to 5 page