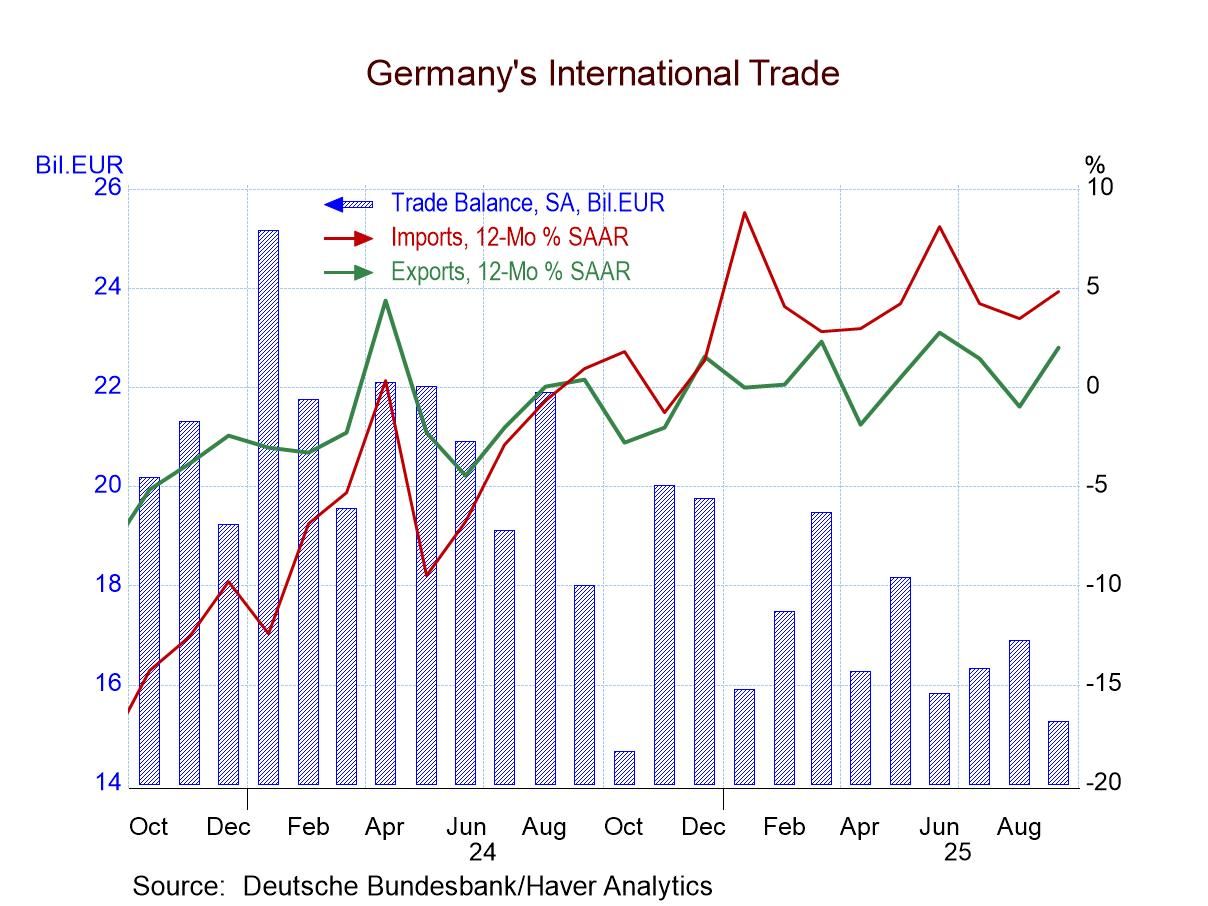
- Manufacturers’ new orders -0.4% (-1.9% y/y) in Nov. vs. +0.5% (+2.1% y/y) in Oct.
- Durable goods orders (-1.2%) fall m/m, while nondurable goods orders (+0.4%) and shipments (+0.1%) increase m/m.
- Unfilled orders rise 0.3%, the fifth straight m/m increase.
- Inventories rebound 0.3%, the first m/m rise since August.
Global| Jan 06 2025
Composite PMI Trend Remains Mixed; Large Economies Improve
The S&P composite PMI tracks economic performance across manufacturing and services sectors for a group of 25 countries; it shows mixed performance in December with conditions slightly slowing for just over half of the reporters. However, among the larger economies, conditions are largely improving with the United States improving and with the European Monetary Union improving in December, including the large individual members of the union: Germany, France, Italy, and Spain. Japan also improves month-to-month in December although among large economies the U.K. economy worsens and worsens for the third month in a row. Condions in China also deteriorate.
The U.S. shows composite conditions improving over 12 months, six months, and three months based on averages, as does Ireland, and Sweden, and Hong Kong. Worsening consistently from 12-months to six-months to three-months is only India. In the case of India, this is a slowing from extremely high readings as the percentile standing for India's composite in December is in its 71.9 percentile tying it for the fourth highest percentile ranking in this sample of countries over the last five years.
While there was still a great deal of slowing, there wasn't that much contraction going on in this group of countries. Only 6 composite readings are below 50, indicating contractions in December compared to seven in November and October. Over three months averages show only 7 contracting; over six months, eight are contracting; and over 12 months six are contracting. In terms of percentile standings, however, 15 of the 25 reporters in the table show relative standings below their medians over the last five years so relative weakness is the rule although contraction is not.
The unweighted average for the sample is for a composite PMI reading of 51.8 which shows a bare-bones expansion. The unweighted U.S., U.K., and European Monetary Union average is at 51.8, the G-7 weighted average is at 52.8, while the G-6 average, that excludes the U.S., is at 48.9. The G-7 weighted average has a 52.6 percentile standing over the last five years while the G-6 GDP-weighted average has only a 29.8 percentile outstanding emphasizing the strength that the U.S. economy imparts to any measure of the performance of the most advanced economies.
Ranked over the last five years, only 10 economies have standings above their medians for this period. The median for the whole sampler is at a 43.9 percentile standing; the average is at a 48.6 percentile standing- there's currently still a great deal of weakness among these countries. The weakest standing in the sample is for France at a 21.1 percentile standing with Singapore's 24.6 percentile standing running a close second, the U.K. ranks third worst at 26.3 percentile, and Ghana's 28.1 percentile standing is in 4th place.
There's little evidence of trend as the chart above shows. The G-7 reading over 12 months, six months, and three months is locked in a narrow range between 52.2 and 52.6; the G-6 range is lower but also narrow between 49.0 and 49.9. The overall average fluctuates between 51.8 for three months and 52.0 over 12 months. For the most part, we're getting readings that are in the growth category but simply not very impressive and readings that are quite low by the standards set over the last five years which was by itself or relatively listless.
- Light truck sales highest since Apr. ’21; imported light truck sales at a record high.
- Auto sales highest since Apr. ’23.
- Domestic & import sales both increase.
- Imports' market share rebounds to 24.7%, the highest since Nov. ’23.
- USA| Jan 03 2025
U.S. ISM Manufacturing Index Improves in December and in 2024
- Index reaches nine-month high.
- New orders & production improve; employment weakens.
- Prices reading gains slightly.
by:Tom Moeller
|in:Economy in Brief
- USA| Jan 02 2025
U.S. Construction Spending Holds Steady in November
- Private construction is little changed as single-family improves but multi-family building declines.
- Nonresidential private construction slips for a second month.
- Public sector construction weakens but highways & street construction improves.
by:Tom Moeller
|in:Economy in Brief
- USA| Jan 02 2025
U.S. Jobless Claims Lowest in 8 Months
- Initial claims just 211,000 in Dec. 28 week.
- Continuing claims down 52,000 in Dec. 21 week.
- Insured unemployment rate returns to long-standing 1.2%.
- Applications to purchase and to refinance plummeted.
- Rates on 30-year fixed-rate loans rose by 23bps in the last 2 weeks.
- Average loan size declined in the last 2 weeks.
Global| Jan 02 2025
Manufacturing PMIs: Ready to Flip the Calendar- Not the Message
The readings improve a bit in December, moving the median to 49.7 from a 3-month average of 49.3. The average of manufacturing among reporting Asian contributors have moved up above 50. The BRIC average remains above 50 but has slipped a bit lower on the month.
However, overall, the percentage of reporters that improved month-to-month is only 27.8%. Two thirds improve over three months compared to six-months based on comparing the averages; 22% improve over six months compared to 12-month averages. And two-thirds improved over 12 months compared the 12-month average from one year-ago. This is not a strong record of improving trends based on breadth.
The changes in the medians calculated over 12 months, 6 months and 3 months show that the median readings have been steadily eroding.
The queue standing places an ordinal ranking on each contributor over data since January 2020. Among the 18 reporters in the table, only five have queue standings above their 50% level (above their respective medians calculated over this period). Four of the countries have standings in the 50-60 percentile range with the highest rankings at a 63.3 percentile standing (Taiwan). China, India, Mexico, and Canada (all either BRIC or U.S. MCA members) are the remaining countries with standings above their historic medians.
Eight reporters in the table have PMI values in December that are above the values they posted in January 2020. The strongest reading is reported by Russia, at a gain of 2.9 points (really?) with the weakest, a drop of 9.1 points in France. The U.S., the U.K., Germany, and the euro area all have drops over this period of 2.5 points or more. The most developed countries seem to be having the hardest time during this episode.
PMI standings log a median at 38.3% for reporting countries over the last five years of data. The High-Low percentages find that Mexico, China, and India have standings in the upper 20 percentile of that range (as opposed to their queue percentile) of data. Only the most developed countries and the euro area, Germany, France, the U.S., the U.K., and Brazil have percentile standings below their high-low midpoints (below the 50 mark).
While the U.S. economy is showing signs of ongoing and even improving growth, the rest of the world is not. Even in the U.S., manufacturing is the laggard sector. The graph shows that since early-2023 there has been little improvement.
- of2636Go to 54 page