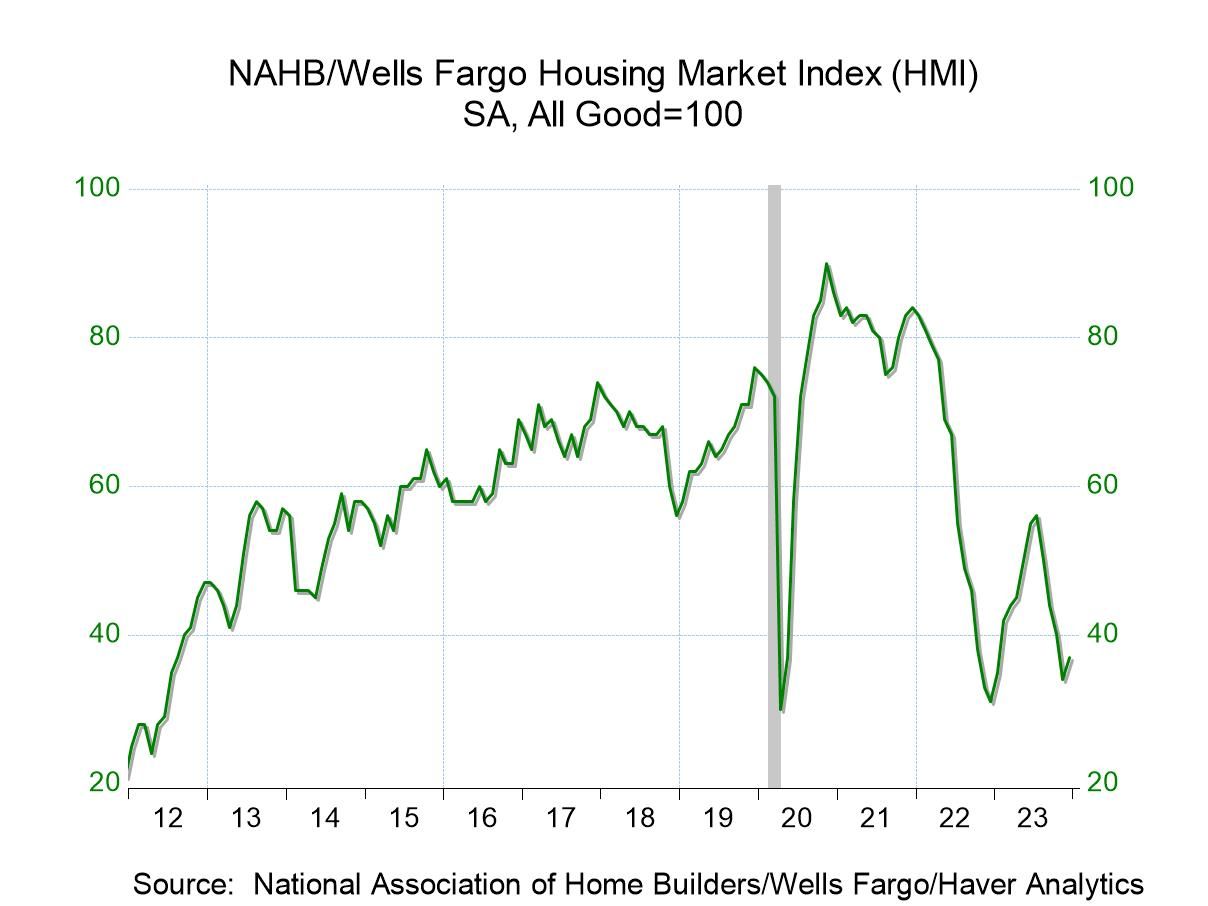
- Modest rebound recoups some of prior month’s decline.
- Prospective buyer traffic increases moderately.
- Improvement stretches across most regions of country.
by:Tom Moeller
|in:Economy in Brief
 Germany| Dec 18 2023
German IFO Weakens Again in December
Germany's IFO Climate gauge slipped to -21.2 in December from -18.3 in November. There was significant climate slippage in the manufacturing sector, in construction, in wholesaling, and in retailing. Only the service sector improved slightly in December compared to November, advancing to a - 1.7 reading from -2.5 in November. This is a common theme for the month as the service sector is the only one that is constantly resilient across the three IFO categories of Climate, Current Conditions, and Expectations.
More on Climate The standings find the Climate readings exceptionally weak. The all-sector queue standing is at its 9.9-percentile, manufacturing is at its 8.6-percentile, construction has the strongest standing in its 25th percentile, wholesaling is at its 8.3-percentile, retailing is at its 21st percentile and services are at their 11.6-percentile. The readings are all in the bottom quartile or right at the border of that quartile as of December. All readings are in double-digit points below where they were in January 2020 just before Covid struck. The climate all-sector reading, the manufacturing reading, and the construction reading all are on their weakest marks since Russia's invasion of Ukraine took place. The wholesaling gauge is up 4.3% from that point, retailing is up 34%, and services are improved by 26% on that comparison. But on the comprehensive IFO gauges we see clearly that since Covid and the Russian invasion Germany has been reeling.
Current Conditions The IFO current conditions gauge also showed broad weakness in December with the all-sector reading weakening and four of the five sectors weakening once again with services being the exception. The service reading crept up to 13.5 in December from 12.5 in November. The rankings for the current indices are stronger than for the climate gauge but still weak; only construction and retailing have current standings above their 50th percentiles which puts them above their medians. The all-sector index has a 13.6 percentile standing which is still quite low, manufacturing has a 25-percentile standing, services have an 18.7 percentile standing, and wholesaling has a 31.5 percentile standing.
Expectations The expectations readings weaken across the board except for services. The services reading moves up slightly to -15.8 from -16.4. However, the all-sector summary reading falls to 23.2 in December from 21.7 in November; the all-sector standing is at its 8.8 percentile, once again, a very weak reading. All the percentile standings for expectations are in the lower 10% of their respective historic ranges. Expectations show an even more downbeat view the economy in Germany in December, worse than the readings for their current conditions or climate.
Germany has been weak for some time these weak IFO readings are not coming out of the blue; they're not a surprise, and they're not different from the gauges we've been seeing from other German measures. However, the data from Germany currently are coming in weaker than data from most other European Monetary Union members. That's a problem since the German Economy is the largest economy in the monetary union. The IFO is ending the year on an extremely downbeat fashion with a set of extremely weak readings across the board.
 USA| Dec 15 2023
U.S. Industrial Production Improves in November
- Factory output increase is led by strong gain in autos.
- Other industry performance is mixed.
- Capacity utilization edges higher.
by:Tom Moeller
|in:Economy in Brief
 USA| Dec 15 2023
U.S. Empire State Manufacturing Index Turns Negative in December
- Weakness is broad-basted amongst categories.
- Inflation pressures ease.
- Six-month outlook improves.
by:Tom Moeller
|in:Economy in Brief

 Global| Dec 15 2023
PMI Weakness Finds Its Stasis
The PMI flash data show essentially flatlining, steady, responses over the last six months. There is a hint of uptrend in the EMU manufacturing series but not much more than a hint. Across reporters in the table, three-month changes in the individual gauges are small everywhere, except the U.K. where relatively strong gains are posted.
Over three months all services gauges are weak with Germany’s 5.6 points decline the largest and the U.K.’s one point decline the smallest. Manufacturing shows two declines over six months, one in France and one in Japan. The U.S. and Germany show the largest gains, posting a rise over six months of about 2 points. However, services gauges dominate the total PMI measure that show declines across the board over six months, with Germany, the EMU, and France logging the largest drops over six months. These point-to-point changes might exaggerate the trend. The average PMI gauges are far more stable.
The 6-month vs. 3-month averages were consistently weaker by about one point or less for the PMI total index except for the U.S. where a near 2-point drop prevailed. Manufacturing 6-month vs. 3-month PMI averages differ by small inconsistent amounts of change across table reporters – the U.S. logs a drop of one point. And the services 6-month vs. 3-month average difference fell by about one point across the board across table entries, but nearly double that in the U.S.
The color-coded table shows strengthening and weakening on the monthly and period sequential data. Monthly data show a good deal of chaos. The 54 observations over those six reporters with 3-metrics each (Composite, Manufacturing, and Services) over 3-months tallied 25 monthly weakening observations vs. 29 strengthening observations. That is quite mixed.
However, the broader sequential changes are much more consistent, showing over the three periods 45 weakening observations vs. nine improvements over 54 observations. The sequential data show clear-cut weakening. Only manufacturing shows strengthening over three months – three of them: for the EMU, Germany, and the U.K. Over six months only the U.S. shows an improvement- it was also in manufacturing. The upshot is that monthly data may be chaotic, but there is a clear trend there.
The queue standings show an average composite standing across members in their 28th percentile. Manufacturing stands in its 11th percentile and services in its 35th percentile – all quite weak. However, only the EMU, Germany, and France had composite PMI diffusion index levels below 50 in December. This underscores that to be weak (in a ranking sense) the PMI does not need to show a decline (reading below 50). PMIs are usually above 50 because services and manufacturing usually expand. Even over this weak-stretch, the service sector PMIs across the reporters in the table were above the breakeven level of 50 about 64% of the time vs. 53% of the time for manufacturing.
From May 2021 to June 2022, the proportion of reporters with both services and manufacturers at PMI values above 50 in the same month, was above 50% consistently. After July 2023, fewer than 20% of the reporters have both services and manufacturing above 50 in the same month. This has been a period of protracted weakness - and it continues.
 USA| Dec 14 2023
U.S. Retail Sales Unexpectedly Improve During November
- Online buying strengthens.
- General merchandise sales ease.
- Gasoline sales continue to decline with lower prices.
by:Tom Moeller
|in:Economy in Brief
 USA| Dec 14 2023
U.S. Import and Export Prices Fell in November
- Decline in import prices due entirely to 5.6% drop in price of imported fuels.
- For exports, lower nonag prices more than offset higher ag prices.
by:Sandy Batten
|in:Economy in Brief
 USA| Dec 14 2023
U.S. Business Inventories Ease While Sales Decline in October
- Wholesale inventories lead total downward.
- Sales fall across industry groupings.
- Business sector inventory-to-sales ratio edges higher.
by:Tom Moeller
|in:Economy in Brief
- of117Go to 4 page