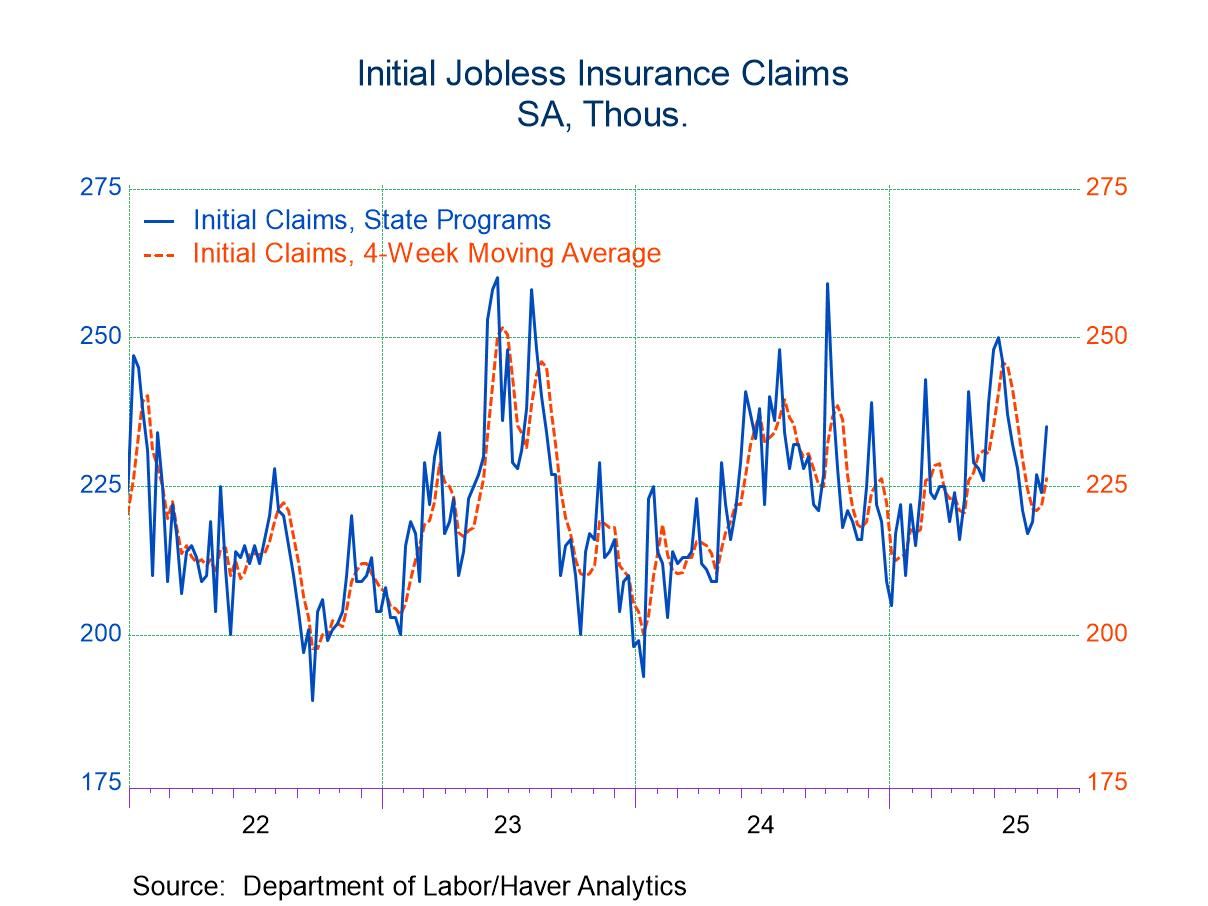
- Initial claims surge to highest level in eight weeks.
- Continuing claims extend upward trend.
- Insured unemployment rate holds steady.
by:Tom Moeller
|in:Economy in Brief
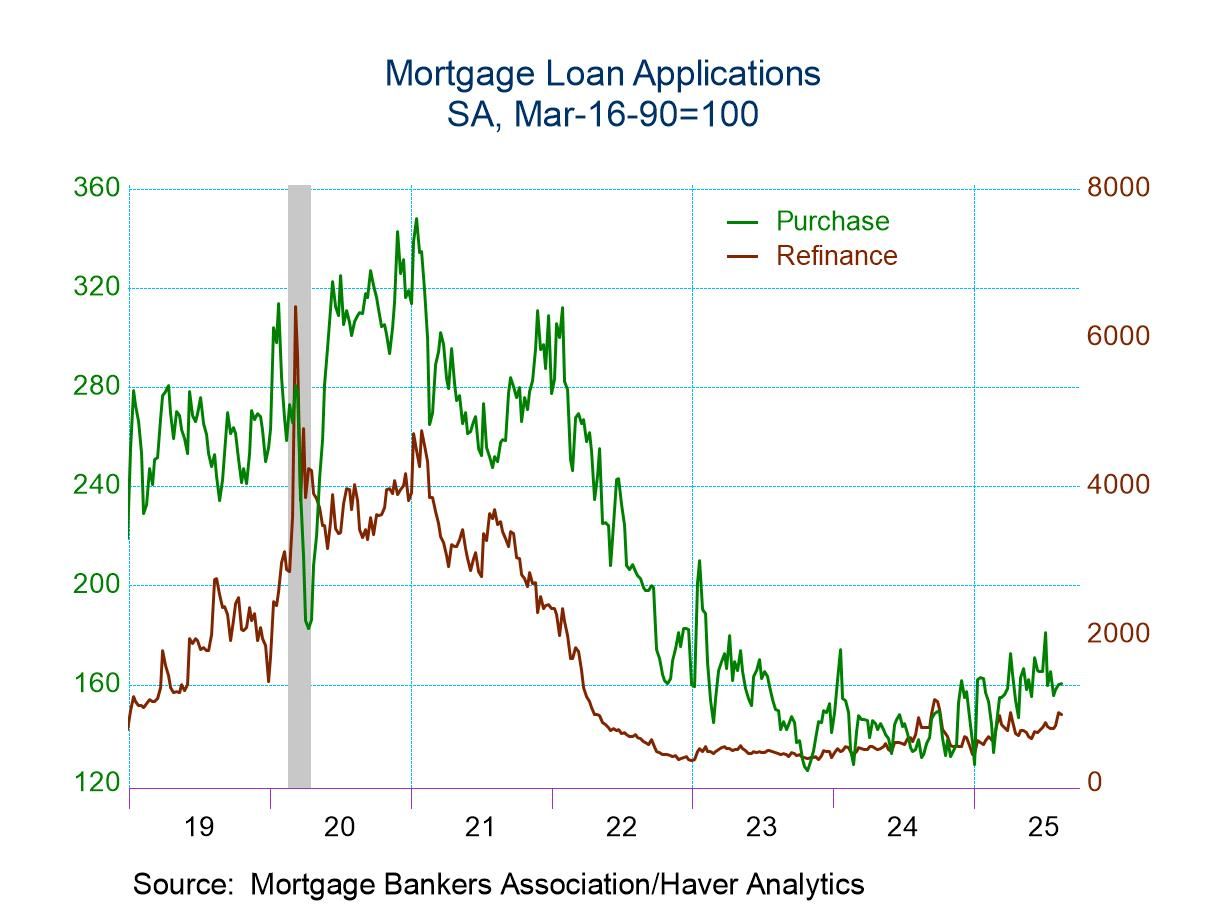
- Purchase applications edge higher while loan refinancing declines.
- Effective fixed-interest rate on 30-year loans remains at four-month low.
- Average loan size declines.
by:Tom Moeller
|in:Economy in Brief
 USA| Aug 19 2025
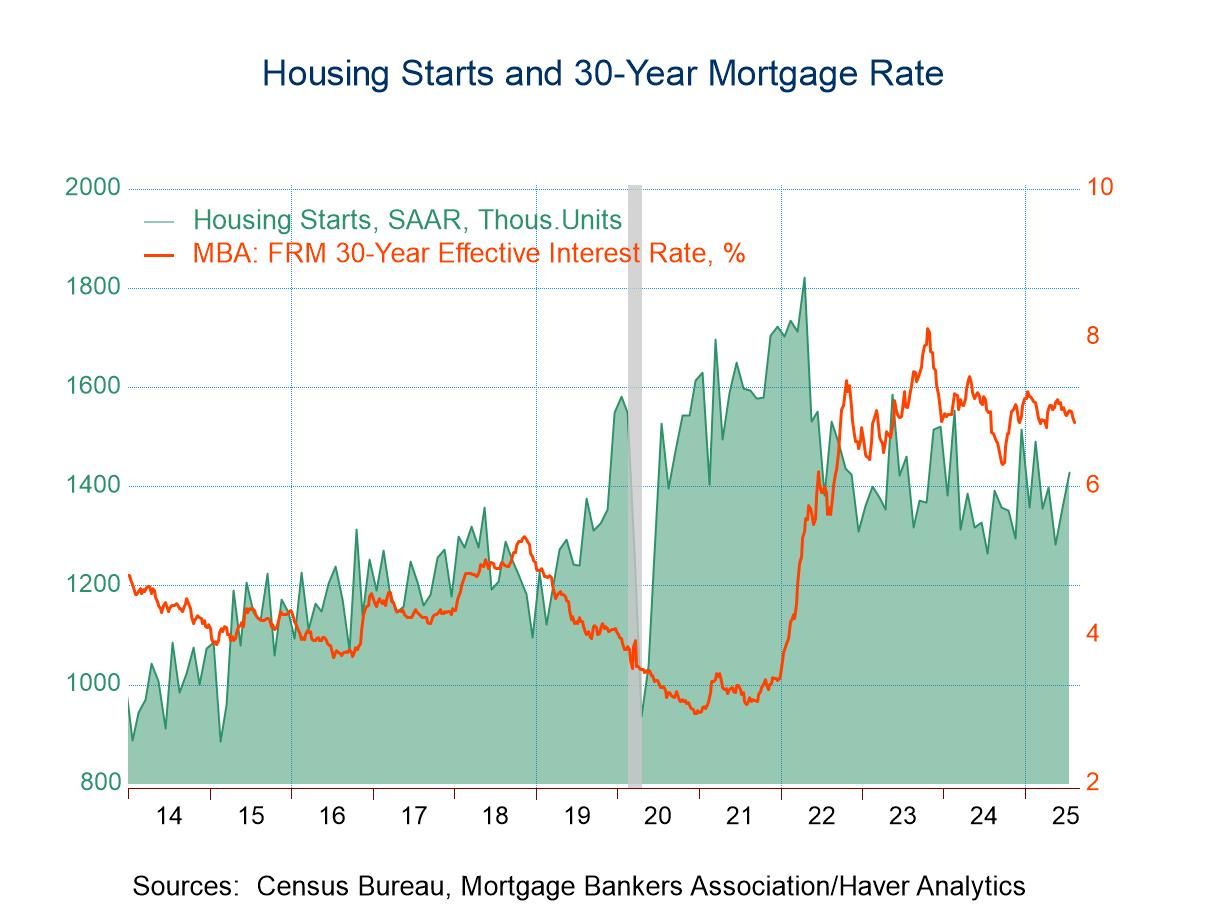
U.S. Housing Starts Strengthen Unexpectedly in July
- Increase brings starts to five-month high.
- Multi-family starts surge while single-family starts rise moderately.
- Building permits decline is led by multi-family.
by:Tom Moeller
|in:Economy in Brief
 USA| Aug 19 2025
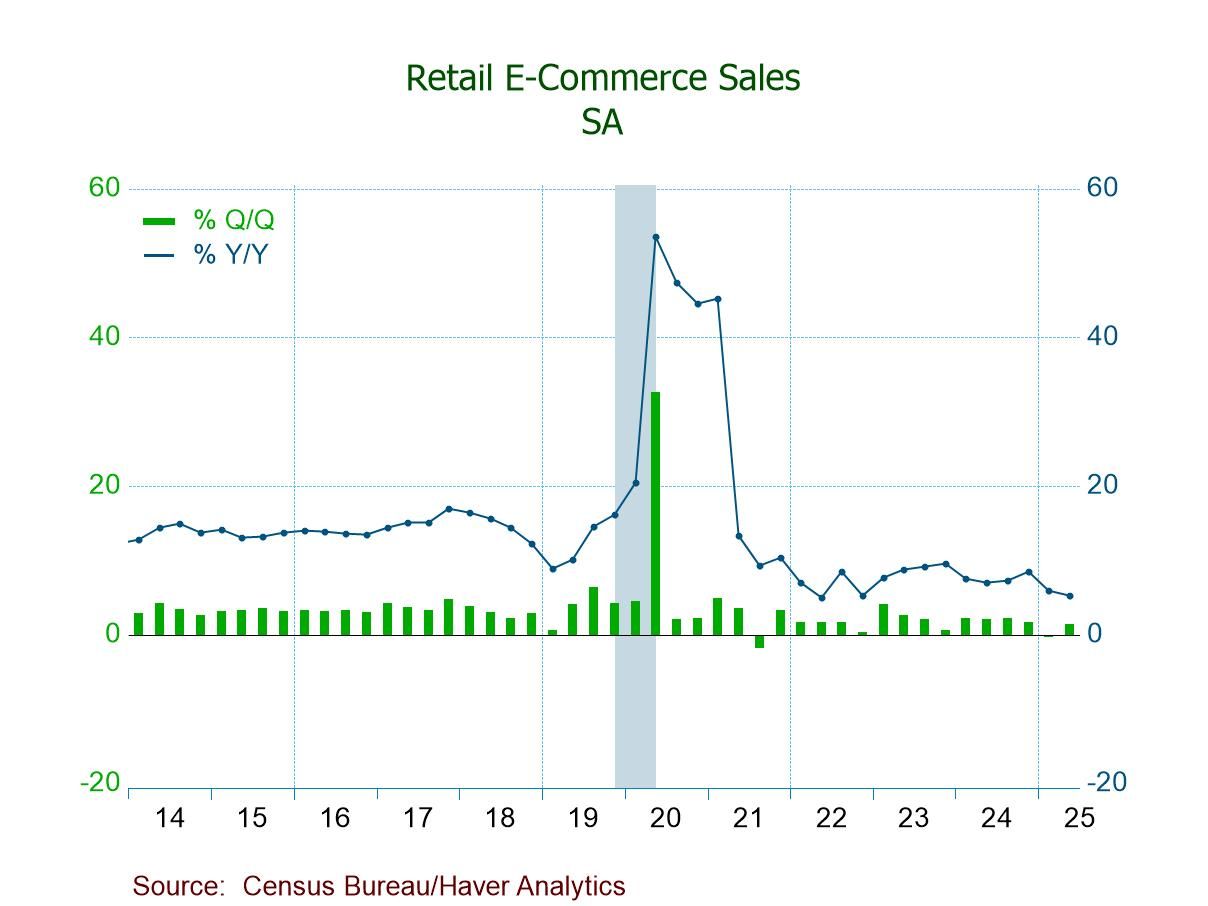
U.S. Retail E-Commerce Sales Rise in Q2'25
- Sales +1.4%, the 14th q/q rise in 15 qtrs.; +5.3% y/y, the lowest since Q2'22.
- Online share of total retail sales up to 16.3%, the highest since Q2'20.
- Nonstore sales rebound, up for the fourth quarter in five.
- Widespread gain in online sales led by bldg. materials & garden equipt. (+34.7% q/q).
 USA| Aug 19 2025
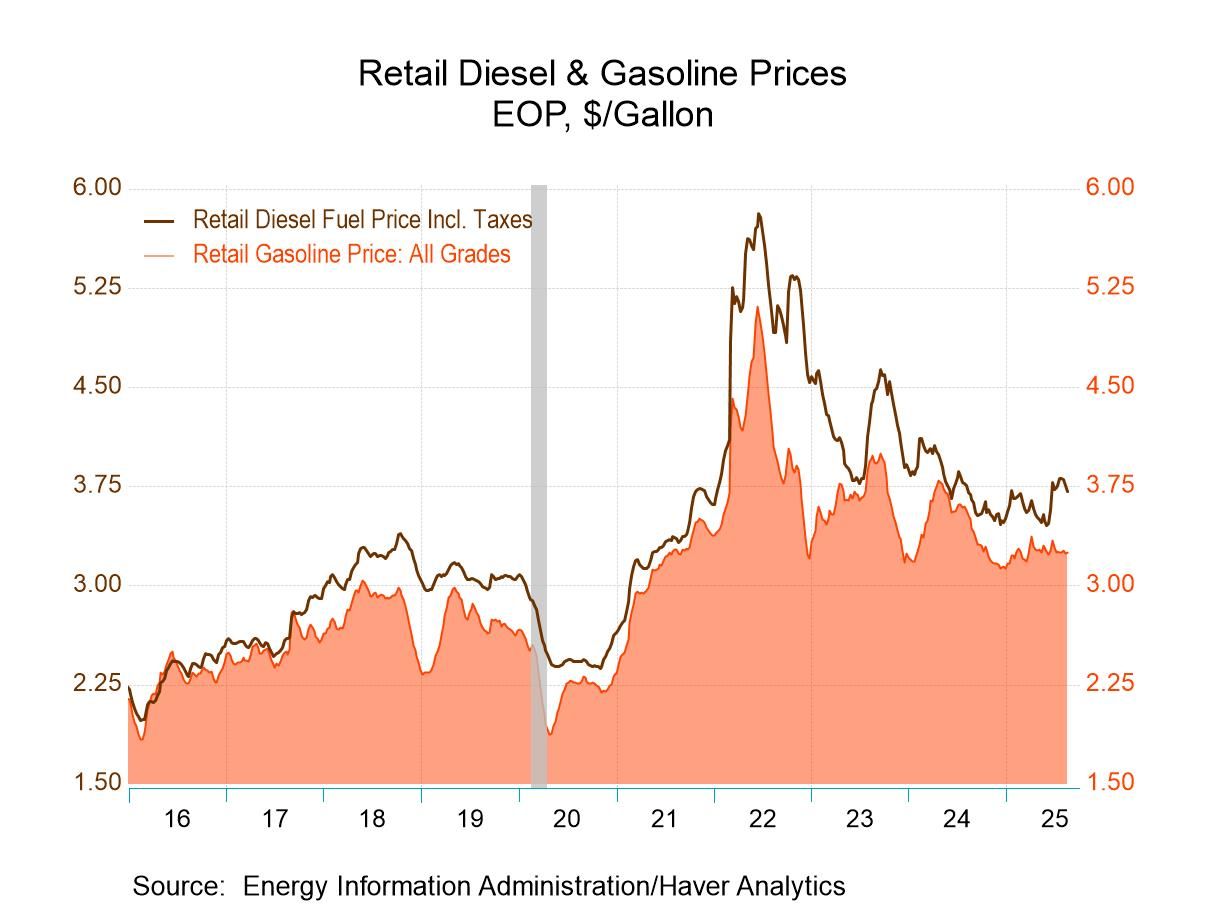
U.S. Energy Prices Are Mixed in Latest Week
Retail gasoline prices for all grades, on average, inched up to $3.25 per gallon (-7.1% y/y) last week after falling to $3.24 one week earlier. Prices remained above their low of $3.13 in the week of December 9. The recent high was $3.79 in the week ending April 22, 2024. Their all-time high of $5.11 occurred in the week ending June 13, 2022. The retail price for on-highway diesel fuel fell to $3.71 per gallon (+0.7% y/y) in the week of August 18 after easing to $3.75 in the prior week. The latest diesel price stood well below a high of $4.63 in the week ending September 18, 2023 and a peak of $5.81 in the week ending June 20, 2022.
The price of West Texas Intermediate crude oil declined to $63.31 per barrel (-19.7% y/y) in the week ended August 15 from $64.71 in the prior week. The drop left prices at the lowest level since the first week of June. Prices remained above a $59.04 low in the second week of May. The cost of crude oil peaked at $120.46 in the week of June 10, 2022. Yesterday, the price was $63.96 per barrel. The price of European Brent crude fell to $67.17 per barrel (-18.6% y/y) in the week of August 15, after falling to $68.17 in the prior week. Prices remained below a recent high of $95.61 in the week of September 29, 2023 and below a peak of $127.40 in June 2022. The price was $68.18 per gallon yesterday.
Natural gas prices slipped to an average $2.94/mmbtu (+38.0% y/y) in the week ended August 15, after falling to an average $2.99/mmbtu in the prior week. Prices remained well above a low of $1.40/mmbtu in the week of March 15, 2024 but below their peak of $9.56 in the week of August 26, 2022. Yesterday, the price was $2.96 per mmbtu.
Gasoline demand declined 1.5% y/y in the four weeks ending August 8, following a 2.2% y/y decline in the prior four weeks. Demand for all petroleum products rose 2.9% y/y in the four weeks ending August 8, after a 1.6% y/y increase in the previous four-week period. Crude oil input to refineries rose 4.2% y/y in the four weeks ending August 8, after a 2.9% y/y gain in the prior four weeks.
Gasoline inventories rose 1.8% y/y in the week ending August 8 after a 0.9% y/y in the prior week. Residual fuel oil inventories fell 25.7% y/y in the week of August 8, after a 25.8% y/y fall in the prior week. Crude oil inventories rose 2.8% y/y in the week of August 8 after a 2.7% y/y rise in the previous week.
Measured in days’ supply, gasoline inventories stood at 25.0 days in the week of August 8, unchnged from the prior week. The recent low was 22.9 days in the week of November 8, 2024. The supply of crude oil held at 25.0 days in the week of August 8, and remained below a high of 31.9 days in the week of March 3, 2023.
These data are reported by the Energy Information Administration of the U.S. Department of Energy. The price and supply/demand data can be found in Haver’s WEEKLY & USENERGY database.
by:Tom Moeller
|in:Economy in Brief
 Asia| Aug 19 2025
Economic Letter from Asia: BRIC by BRIC
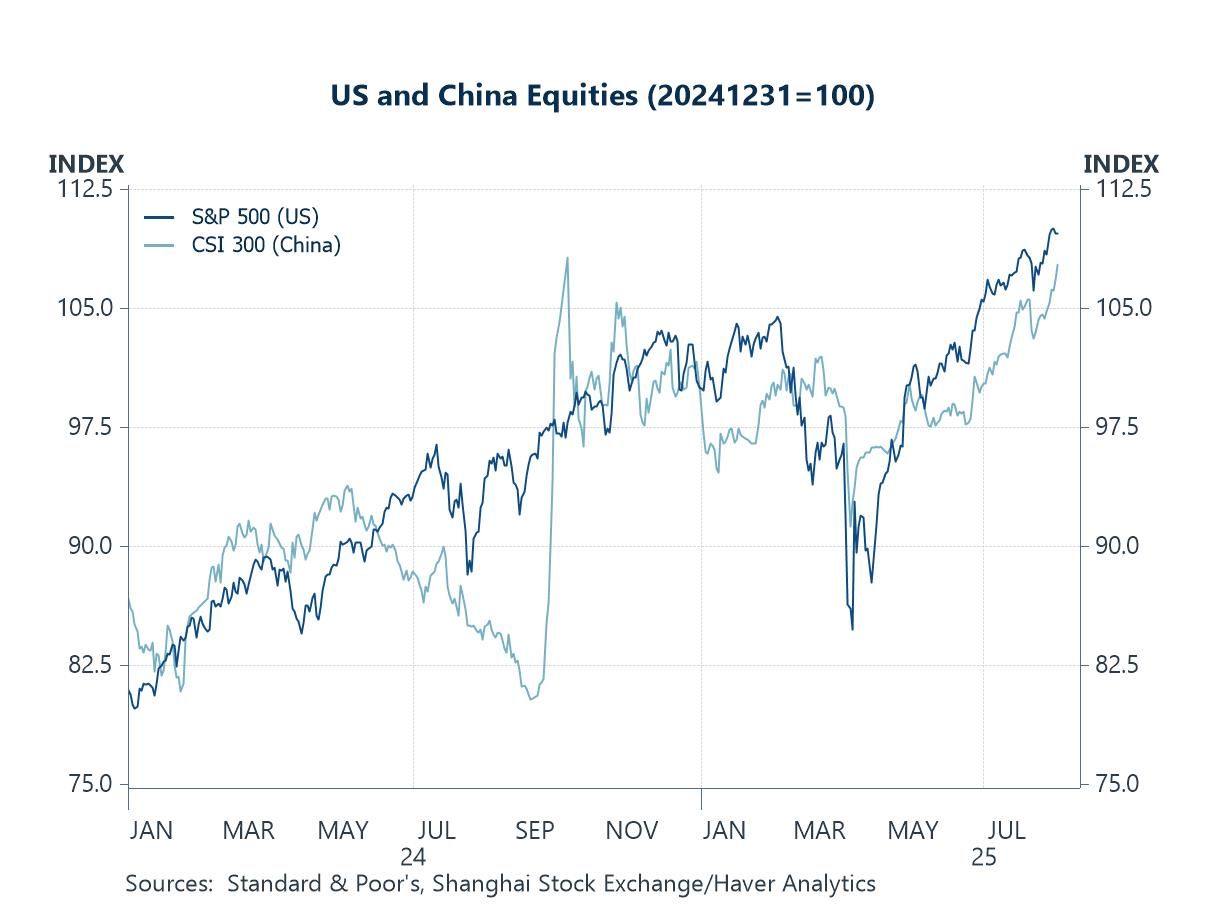
This week, we examine recent developments in US-China trade and assess the broader implications of US trade actions for the BRIC bloc—Brazil, Russia, India, and China. Last week, the US and China extended their tariff truce by 90 days, a move welcomed by equity markets (chart 1). While this pause eased fears of renewed trade tensions, it remains temporary and fragile, with no durable resolution in sight.
As for China’s economy, July data disappointed: retail sales, industrial production, and fixed-asset investment all missed expectations (chart 2). This may signal that tariffs are beginning to bite, as earlier growth drivers—such as some front-loading of imports and one-off consumption boosts like China’s durable-goods subsidy—are fading (chart 3). Newer measures, including loan-interest subsidies, may provide some interim relief. Meanwhile, the property sector remains under heavy strain, with further price and investment declines evidenced in July (chart 4).
In the broader regional context, US trade measures may inadvertently push trading partners closer together, complicating Washington’s bilateral strategy. The BRIC bloc shows tentative signs of greater alignment, though this has yet to appear in data for trade flows (chart 5). China and India, however, are warming toward one another: Foreign Minister Wang Yi’s visit to India this week—focused on the Himalayan border among other issues—suggests an improving dialogue. Separately, discussions at the national level to restart direct flights between the two countries also signal a thaw. Full economic integration remains distant, but the scale of both economies suggests significant potential if relations continue to improve (chart 6).
The US-China tariff truce Last week, the US and China announced a 90-day extension to their mutual tariff truce. Although largely expected, the move still generated further equity market gains (see chart 1). This contrasts sharply with worst-case scenarios earlier this year, when tensions peaked and Washington imposed sweeping tariffs of 145% on Chinese imports — levels that would have severely disrupted global trade and growth if sustained. Instead, both sides agreed to keep additional tariffs at 10% until November 10, allowing more time to pursue a durable trade deal. Still, this is merely a pause rather than progress.
 USA| Aug 18 2025
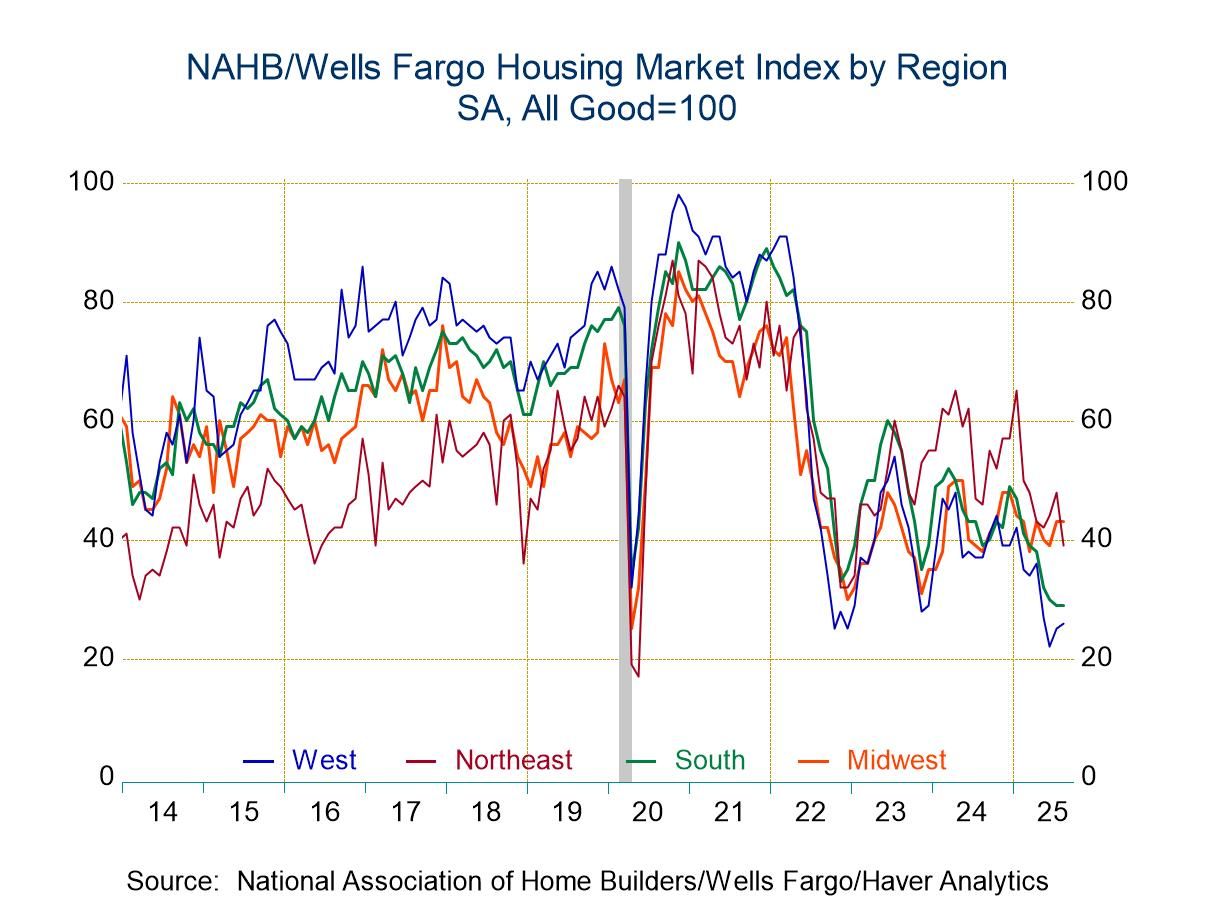
U.S. Home Builders Index Edges Lower in August
- Overall reading matches lowest level since December 2022.
- Current sales slip, expectations steady, while traffic improves.
- Lower Northeast reading accounts for overall index decline.
by:Tom Moeller
|in:Economy in Brief
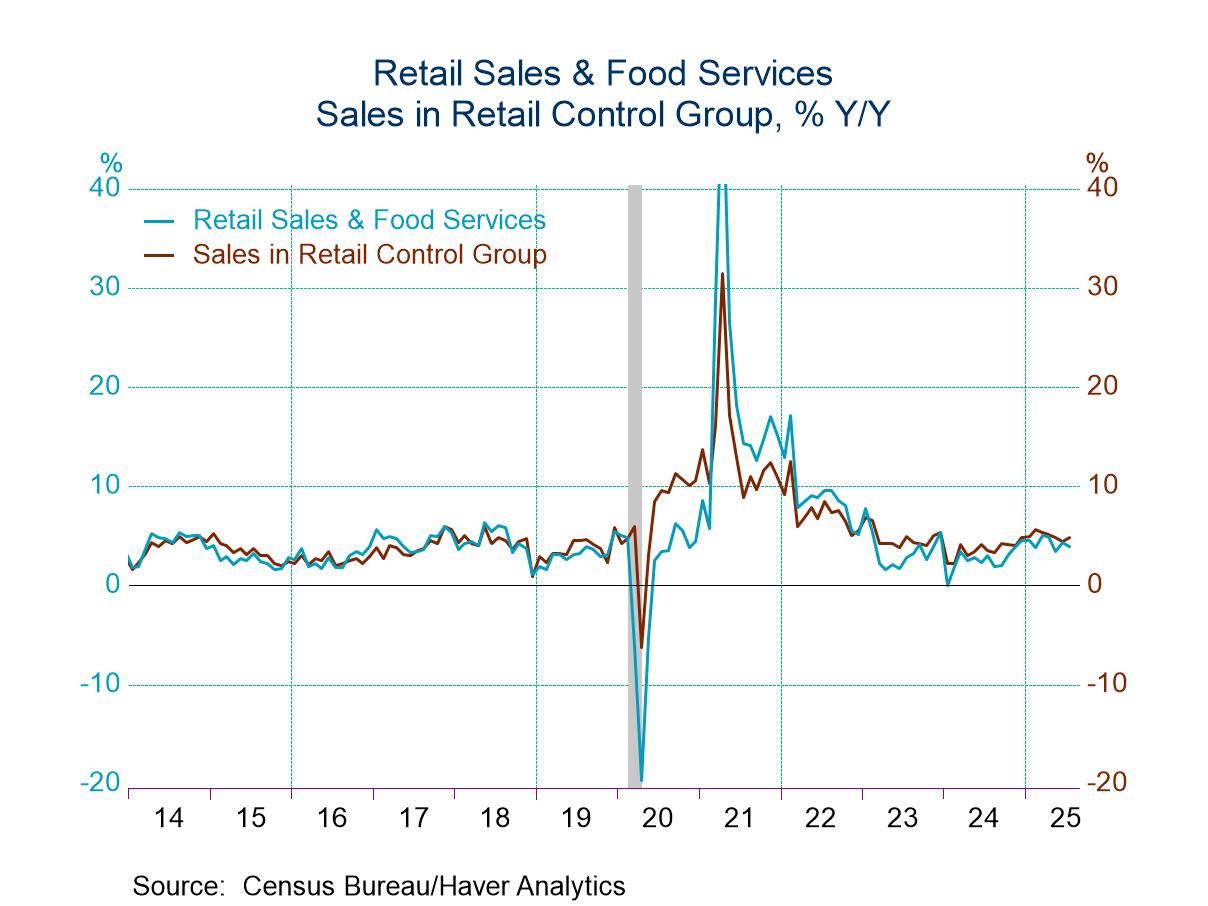
- Strong vehicle sales pace the increase.
- Nonauto sales are mixed.
- Sales in the retail control group (used to estimate PCE) increase.
by:Tom Moeller
|in:Economy in Brief
- of9Go to 4 page