U.S. Home Builders Index Edges Lower in August
by:Tom Moeller
|in:Economy in Brief
Summary
- Overall reading matches lowest level since December 2022.
- Current sales slip, expectations steady, while traffic improves.
- Lower Northeast reading accounts for overall index decline.
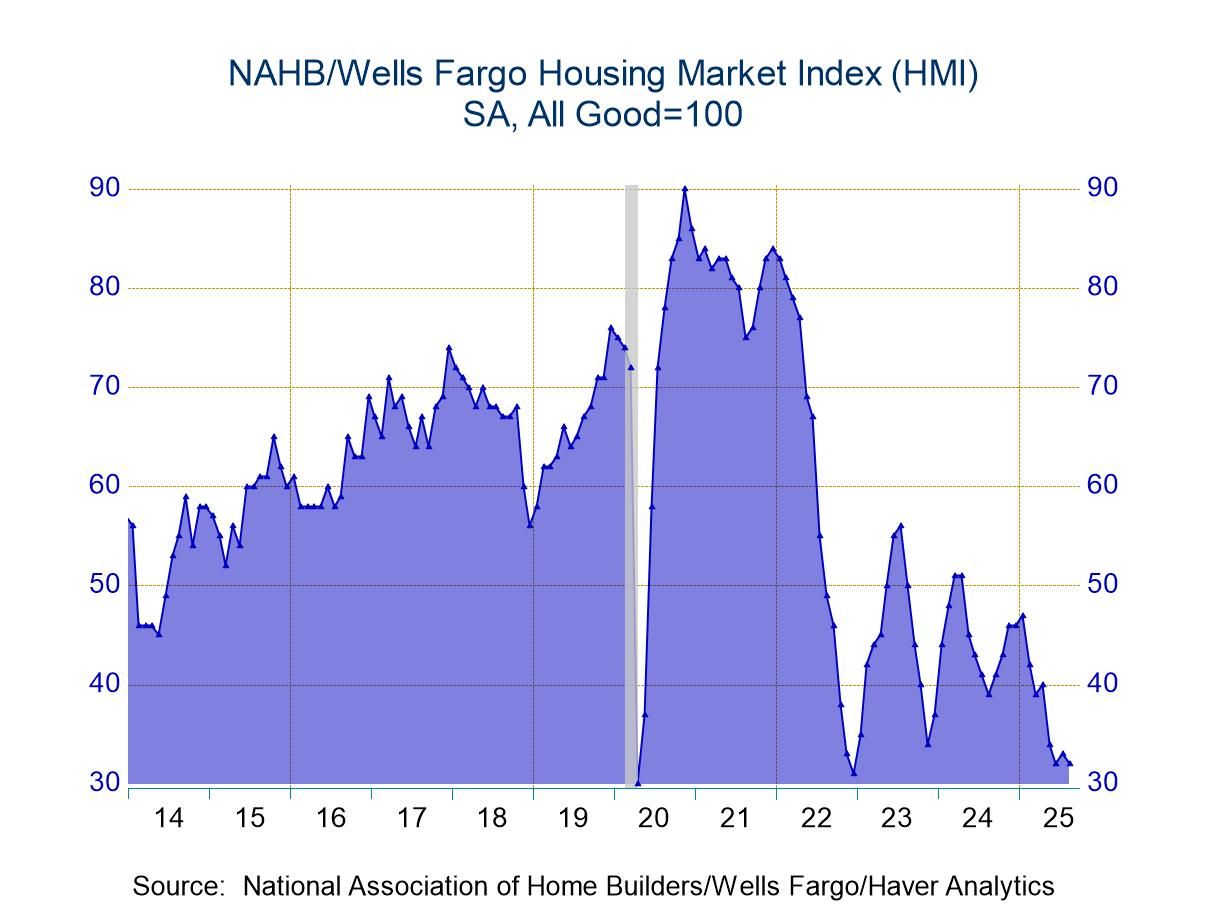
The Housing Market Index, compiled by the National Association of Home Builders/Wells Fargo, eased 3.0% (-17.9% y/y) to 32 in August, reversing the 3.1% July rise to 33. It remained below the break-even point of 50, where it’s been since May of last year. The index remains below a July 2023 high of 56 and a November 2020 peak of 90.
The rate on a 30-year fixed rate mortgage averaged 6.61% in the first two weeks of August versus 6.72% during all of July. It fell to 6.58% last week and remained below the high of 7.79% in the last week of October 2023, according to Freddie Mac.
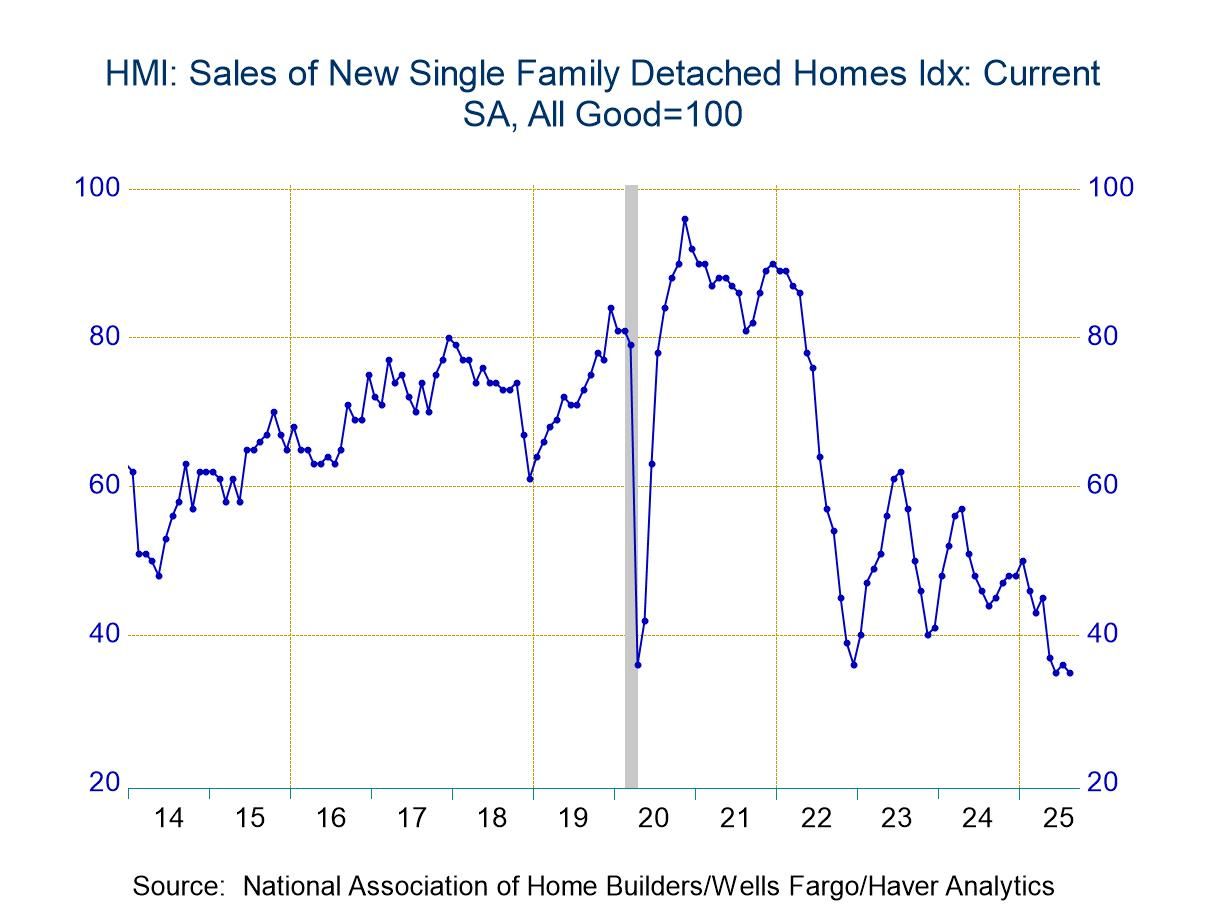
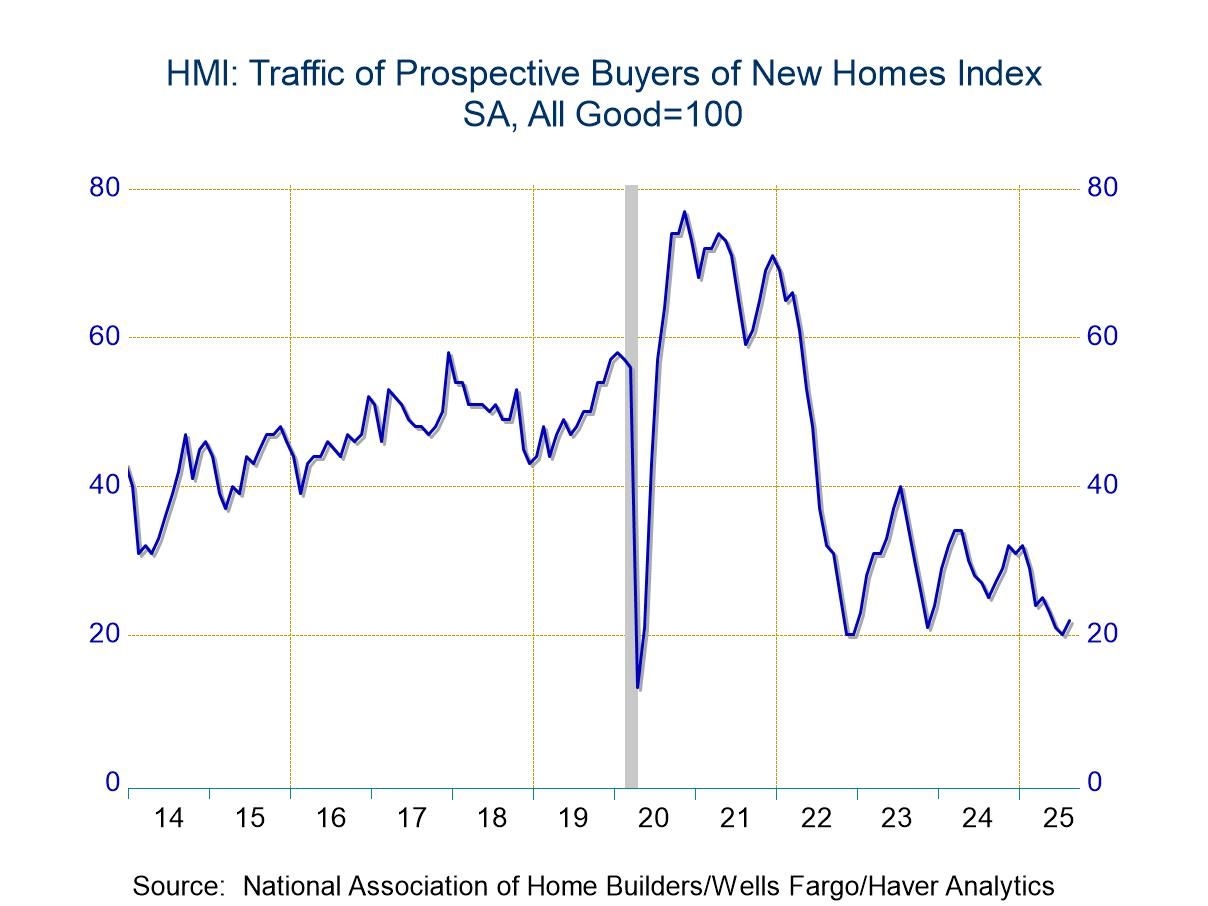
The single-family sales measure declined 2.8% (-20.5% y/y) this month to 35, after rising 2.9% in July. The prospective sales in six months measure held steady (-12.2% y/y) at 43, after rising 7.5% in July. The traffic of prospective buyers’ index rose 10.0% (-12.0% y/y) to 22 in August, after declining 4.8% in July.
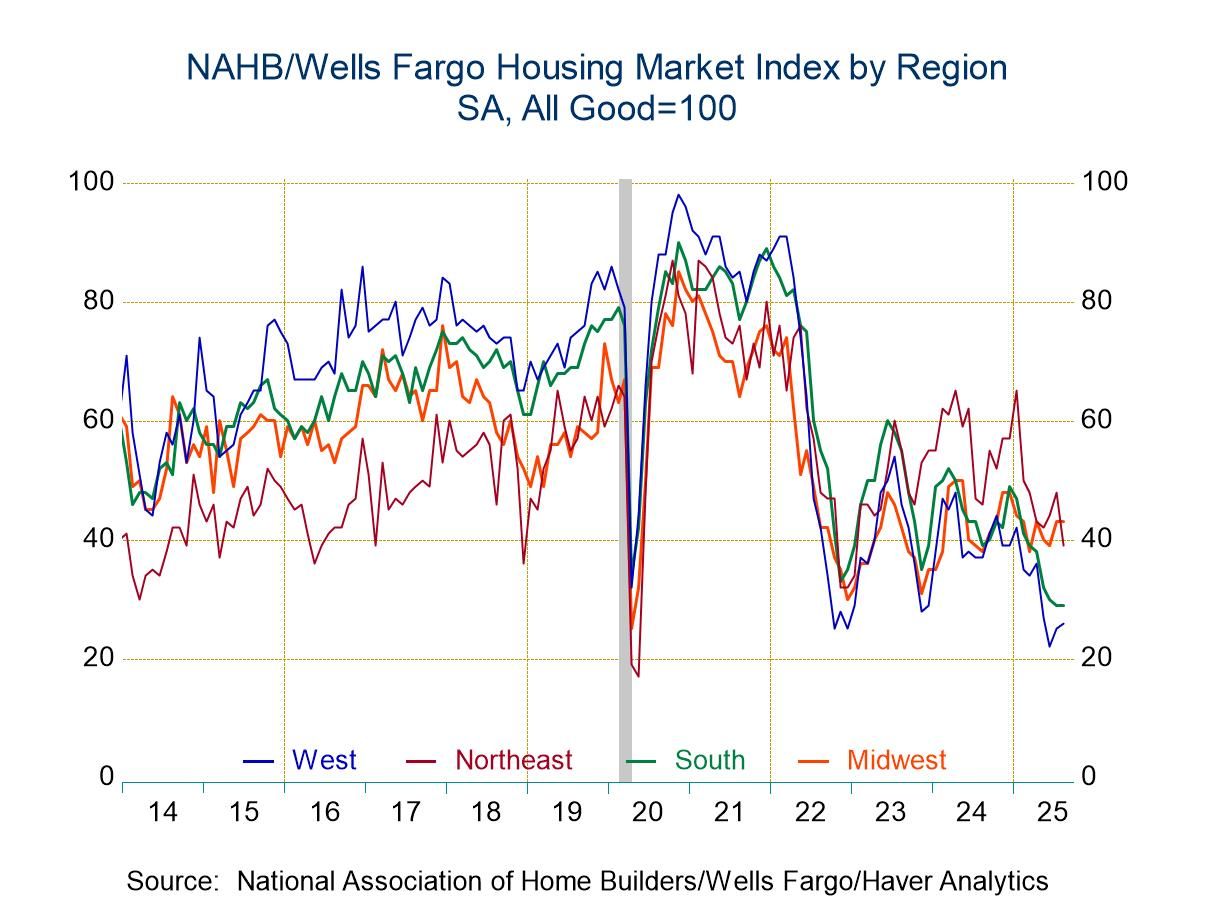
Housing weakness centered in the Northeast this month with the index declining 18.8% (-15.2% y/y) to 39, after rising 9.1% in July. It was the lowest level since January 2023. In the West, the index rose 4.0% (-29.7% y/y) to 26, its highest level in three months. The index for the Midwest held steady (+13.2% y/y) at 43, and matched the highest level in four months. The index in the South also held steady at 29 (-25.6% y/y), after falling in each month of this year.
The NAHB has compiled the Housing Market Index since 1985. It reflects survey questions which ask builders to rate sales and sales expectations as "good," "fair" or "poor" and traffic as "very high," "average" or "very low." The diffusion indexes with values over 50 indicating a predominance of "good"/"very high" readings. In constructing the composite index, the weights assigned to the individual index components are: 0.5920 for single-family detached sales, present time, 0.1358 for single-family detached sales, next six months, and 0.2722 for traffic of prospective buyers. The regional indexes run back to December 2004.
These data are included in Haver's SURVEYS database.

Tom Moeller
AuthorMore in Author Profile »Prior to joining Haver Analytics in 2000, Mr. Moeller worked as the Economist at Chancellor Capital Management from 1985 to 1999. There, he developed comprehensive economic forecasts and interpreted economic data for equity and fixed income portfolio managers. Also at Chancellor, Mr. Moeller worked as an equity analyst and was responsible for researching and rating companies in the economically sensitive automobile and housing industries for investment in Chancellor’s equity portfolio. Prior to joining Chancellor, Mr. Moeller was an Economist at Citibank from 1979 to 1984. He also analyzed pricing behavior in the metals industry for the Council on Wage and Price Stability in Washington, D.C. In 1999, Mr. Moeller received the award for most accurate forecast from the Forecasters' Club of New York. From 1990 to 1992 he was President of the New York Association for Business Economists. Mr. Moeller earned an M.B.A. in Finance from Fordham University, where he graduated in 1987. He holds a Bachelor of Arts in Economics from George Washington University.
More Economy in Brief


 Global