

- Both single-family & multi-family starts jump.
- Improvement fails to include the Northeast.
- Smaller gain in building permits dominated by single-family.
 USA| Jun 20 2023
U.S. Housing Starts Surge in May
by:Tom Moeller
|in:Economy in Brief
 USA| Jun 20 2023
U.S. Home Builder Index Strengthens in June
Index improves to 11-month high. Current sales & traffic strengthen. Regional activity improves broadly.
by:Tom Moeller
|in:Economy in Brief
 Europe| Jun 20 2023
EMU Export and Import Growth Sink as Trade Balance Waffles
Trade flows tell us that Europe is weak- The most striking feature about trade and the European Monetary Union as well as in the U.K. in April is the uniformity of weakness of exports and imports over three months and six months. The table displays data for the European Monetary Union aggregate for exports in manufacturing and nonmanufacturing, and for imports in manufacturing and nonmanufacturing. Total exports and imports are presented for France, Germany and the U.K. For other EMU members, Spain, Finland, Portugal, Belgium, and Italy, export data are presented. For all these countries and for the larger EMU economic unit, only Germany has positive export growth over three months and six months. France has positive export growth over three months and all the remaining entries have negative export growth - declining exports and declining imports (where shown)- on balance over three months and six months. The trade data are pointing to significant weakness in economic growth in Europe as of April. It is unusual for economic data to coalesce in such a striking and uniform picture.
Trade in EMU In the European Monetary Union, exports rise 1.1% over 12 months then fall by 10.4% over 6 months at annual rate and at a 10.5% annual rate over 3 months. Total imports register a similar but weaker profile with imports falling 9.5% over 12 months, at a 22.8% annual rate over 6 months and at a 15.4% annual rate over 3 months.
EMU manufacturing exports rise by 2.4% over 12 months, falling to a -12.5% annual rate over 6 months; they log a -8.5% annual rate over 3 months. Imports, by comparison, are slightly weaker over 12 months, falling by 0.7%, but then outperform exports by falling only a 10.7% annual rate over 6 months and at only a 3.4% annual rate over three months.
Nonmanufacturing trade shows exports lower by 4% over 12 months, flat over 6 months and falling at an 18.8% annual rate over three months. Imports, by comparison, are much weaker owing to the inclusion of energy where prices have been falling much faster. Imports fall at a 24.7% annual rate over 12 months, at a 42.6% annual rate over 6 months and at a 36.4% annual rate over 3 months.
Country data and trends The two largest economies in the EMU show weak trends although exports hold up better than imports. For Germany, exports rise 7.6% over 12 months, at a 1.7% annual rate over 6 months, and at a 0.8% annual rate over 3 months. These are positive growth rates over each horizon. But growth is steadily diminishing – a clear weakening pattern for German exports. For France, exports rise 9.5% over 12 months, then decline at a 6.5% annual rate over 6 months; they then recover to grow at a 0.7% annual rate over 3 months. The three-month growth rate interrupts the pattern of progressive deterioration, but there's a clear tendency to weaker growth across French exports. On the import side, both German and French exports show weakness; but only French imports show ongoing progressive weakness.
U.K. trends- The U.K., which is no longer a monetary union nor EU member, shows sharp declines in exports that nonetheless continue to rise 24.2% over 12 months. U.K. exports fall at a 14.6% annual rate over 6 months and fall at an outsized 54.9% annual rate over three months. U.K. imports fall 1.2% over 12 months and fall at 10.1% annual rate over 6 months, then slow their descent slightly with a 7.1% annual rate drop over 3 months.
Other EMU members- Next, we look at a group of countries of various sizes for Europe; all of these are European Monetary Union members. Finland, Spain, Portugal, Belgium, and Italy show declines in exports over 3 months and 6 months while most of them also show declines over 12 months with only Portugal and Italy being exceptions. Italy logs a 4.3% increase in exports over 12 months while Portugal eeks out a 0.2% increase.
 USA| Jun 16 2023
U.S. Business Inventories Rebound in April; Sales Rise
- Factory inventories strengthen.
- Retail & wholesale sales improve.
- I/S ratios ease m/m, but remain elevated.
by:Tom Moeller
|in:Economy in Brief

 Global| Jun 16 2023
Charts of the Week (June 16, 2023)
Central banks have stolen the limelight over the past few days but with policy shifts that reveal stark differences – and perhaps greater disagreement among policymakers - about the outlook for their respective economies. For example, the decision by the US Federal Reserve to pause its tightening campaign, while simultaneously hinting at future rate hikes in the coming months, undoubtedly raised a few eyebrows. Meanwhile, China's decision this week to reduce its 7-day reverse repo rate by 10bps, lowering it from 2% to 1.9%, was also noteworthy but not entirely surprising given a series of disappointing data releases. As for the ECB, this week’s decision to lift its key policy rates by a further 25bps came as no surprise even though the incoming growth data from the euro area have been equally underwhelming (compared with China). Against this backdrop, our charts this week focus on the Fed’s tightening campaign (in chart 1), the recent strength of global equity markets (in chart 2), and US and broader global inflation issues (in charts 3 and 4). We then turn to the growing inflexibility of the UK labour market (in chart 5) and finally focus on China’s disappointing reopening phase (in chart 6).
by:Andrew Cates
|in:Economy in Brief
 USA| Jun 15 2023
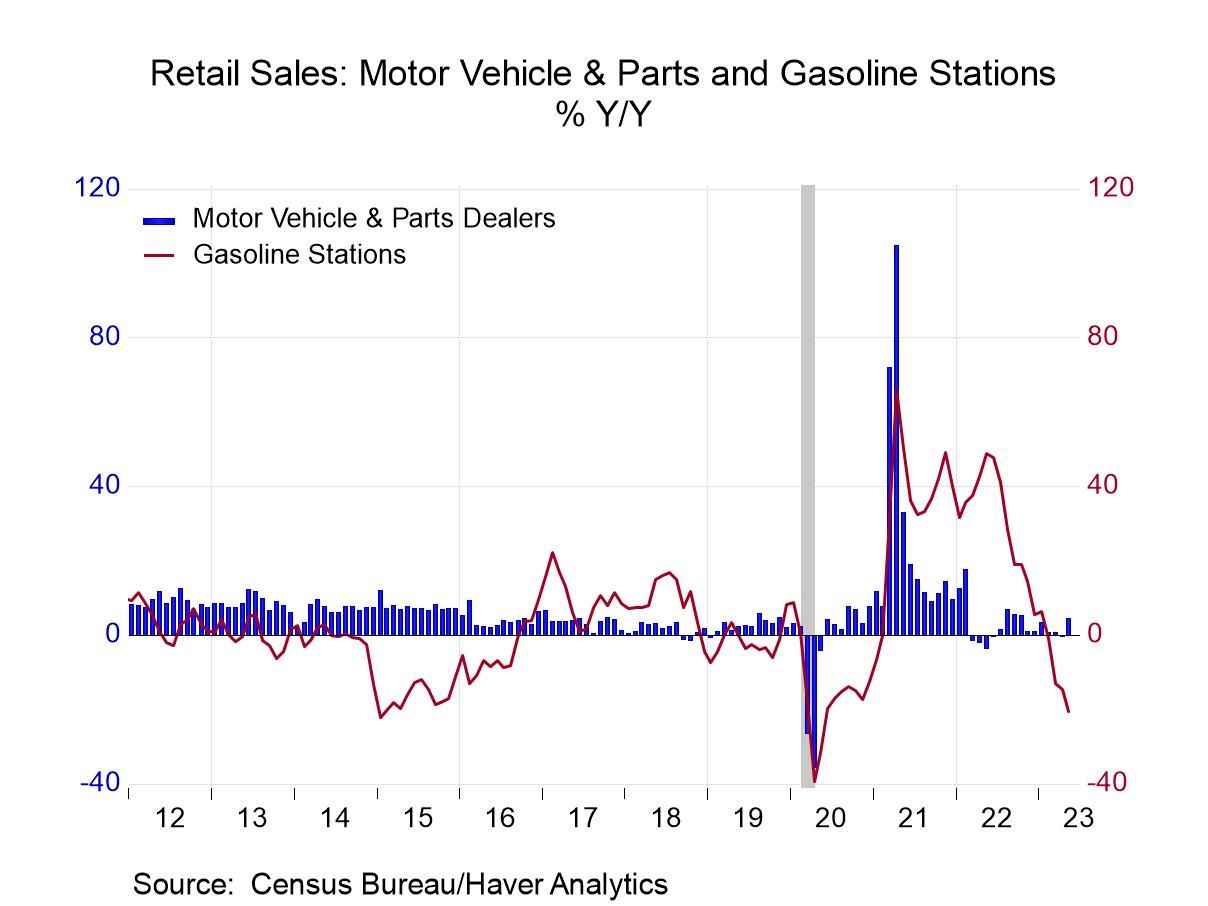
U.S. Retail Sales Are Unexpectedly Firm in May
- Motor vehicle & building material sales strengthen.
- Core goods increase moderates.
- Lower gasoline prices continue to lessen overall gain.
by:Tom Moeller
|in:Economy in Brief
 USA| Jun 15 2023
U.S. Industrial Production Slows in May after Sizable April Gain
- Overall industrial production down 0.2%.
- Manufacturing output increases slightly after April’s big gain.
- Total capacity utilization edges down, but holds steady in manufacturing.
 USA| Jun 15 2023
U.S. Import and Export Prices Decline
- Import price decline led by large drop in fuel prices.
- Excluding fuels, import prices decline minimally.
- Export prices fall sharply.
by:Tom Moeller
|in:Economy in Brief
- of2728Go to 321 page