

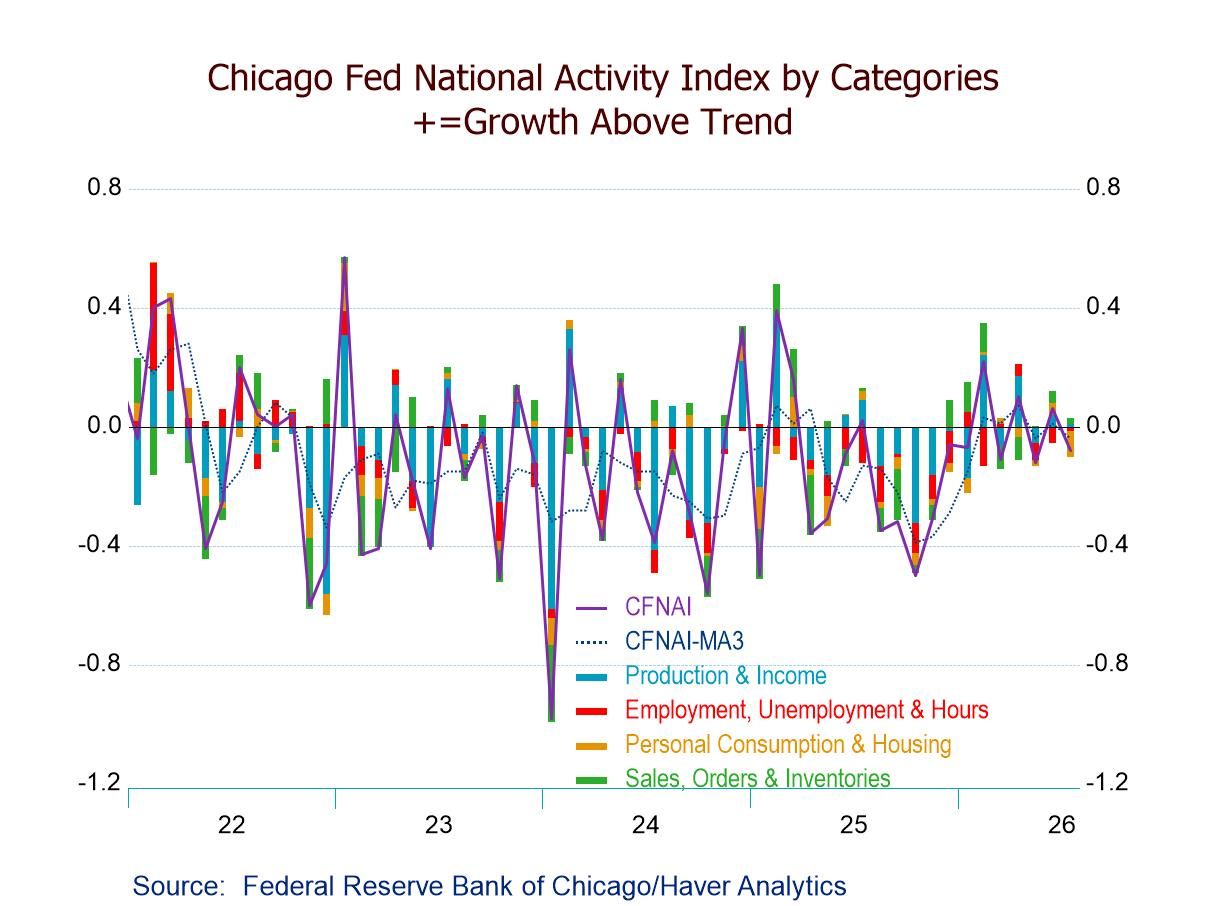
- CFNAI down to -0.08 in July, negative for the second time in three months.
- Three of four CFNAI components down m/m; two make negative contributions.
- CFNAI-MA3 down to -0.04, second negative reading in three mths.; still above -0.70 (recession signal).
- CFNAI Diffusion Index down to +0.05, remaining positive for the fourth time in five mths.
 USA| Aug 24 2026
Chicago Fed National Activity Index Negative in July After June’s Upwardly Revised Positive Reading
 Sweden| Aug 24 2026
Sweden’s Housing Market Shows Signs of Life
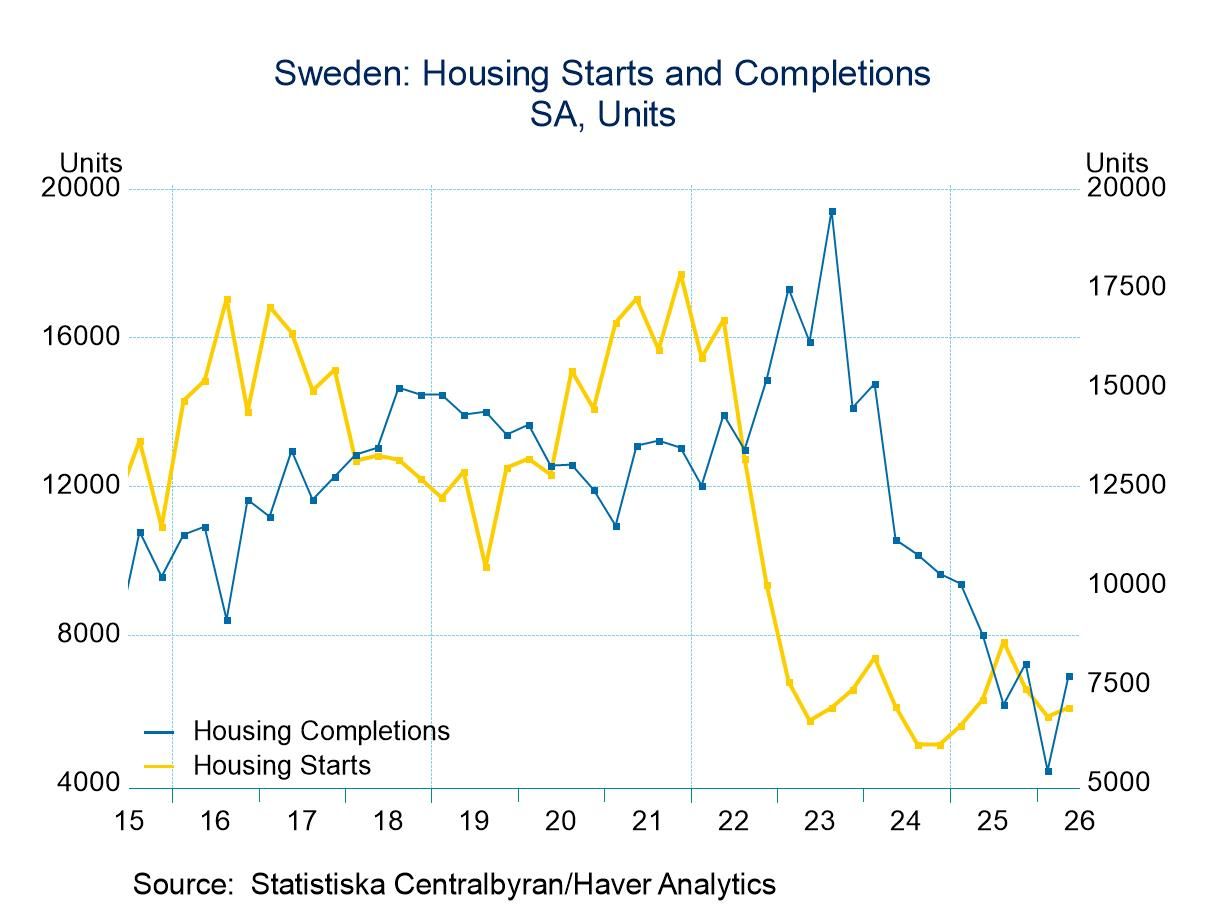
Sweden ended its rate cutting back in the third quarter of 2025. Since then, housing prices have drifted higher. However, housing activity, starts, have had a minor bounce from their lows but no real recovery. Starts are still well below their 2015-2022 levels. But the pace of decline has slowed and given way to oscillation and stability.
Sweden’s inflation rate has fallen back down to its pre-Covid pace. Inflation is no longer a problem there as the headline and core rates for two consecutive quarters are below the 2% mark and look comfortable there. House prices have stabilized. There has not been a year-on-year drop in house prices since 2024-Q1.
Housing completions in this environment have a one-quarter bounce. It’s too early to call this a bottom in completions, but we do have what looks like a spike low in completions. With housing prices creeping back up, having risen for three quarters in a row, the market is beginning to look firmer.
The economy is back in gear, with industrial production rising as of the end of 2024 and logging growth rates of over 4% year-over-year, even after slowing from its rapid recovery from mid-2024 to 2025-Q3.
Sweden shows the signs of having a soft landing in the wake of all the Covid excesses, even with the post-Covid War in Ukraine and the more recent bottlenecks for energy and other supplies in the Strait of Hormuz. Only time will tell if the authorities can continue this run of good policy results.
Monetary policy seems well positioned, with the policy interest rate less than a percentage point above the inflation rate but more than one and one-half percentage points above the core rate of inflation. Interest rates in Sweden were last dropped in late 2025.
Sweden is less affected by the complications in the Middle East and principally uses fossil fuels in its economy to fuel transportation. Apart from that, it has a rich resource of hydro, nuclear, and green energy. This helps give it a buffer against the rollicking prices in the global energy sector and to buffer it from some of that uncertainty.
 Asia| Aug 24 2026
Economic Letter from Asia: Heating Up
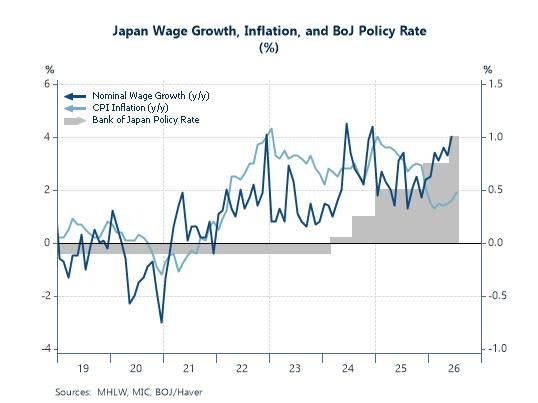
In this week's Letter, we examine how Japan's hard-won reflation is being tested by an energy shock and a fiscal turn. Japan has come a long way in achieving substantive inflation and, more recently, real wage growth, substantiating its tightening cycle (chart 1). Q2 real GDP growth nonetheless underwhelmed, dragged partly by a slump in public inventories that may prove one-off (chart 2). More discouraging was private consumption, whose contribution to growth was flat over the quarter. Delving into the household picture, real spending has continued to shrink despite real wage gains in recent months (chart 3). Elevated energy prices appear to be affecting household behaviour, stalling the translation of higher wages into domestic demand-led growth.
Recent market moves have reflected other drivers, including renewed yen weakness after a short-lived appreciation prompted by intervention. Government bond yields have surged, reflecting both tightening expectations and concerns over Japan's fiscal health, in a climb extending well beyond Japan (chart 4). One potential offset to elevated global oil prices is domestic, and it lies in rice. Last year's constrained supply has evolved into a glut this year, with prices diving (chart 5). Given rice's weight in the consumption basket, the deflationary effects may be significant. Lastly, we turn to fiscal prospects, with talk of the 2027 budget already underway. Investors are watchful of the cabinet's expansionary bias, and how increased spending and food tax cuts may lift bond issuance, with details still scant at this juncture (chart 6).
Japan’s state of play Japan has already managed to get many things going in its favour. After decades of low to negative inflation, consumer inflation rose above 2%, though it has since eased to just above 1% (chart 1). Accompanying the pickup in price pressures is wage growth, which has risen in nominal terms over recent years. Only more recently has it grown in excess of consumer inflation, indicating an interim period of real wage growth that generally benefits households. Sustained inflation alongside wage growth is what the Bank of Japan has long sought. With such conditions among others fulfilled, the central bank had some justification to begin normalising monetary policy, with its latest rate hike in June this year. Complications nonetheless remain. Persisting tensions between the US and Iran are keeping oil prices elevated, threatening to upend Japan's recovery in its domestic sector. They have also prompted government measures to support growth and help households tide through price increases. Those measures have drawn their own concerns, especially over Japan's fiscal health, which we discuss in more detail later.
 Global| Aug 21 2026
Flash S&P PMIs Show Ongoing Improvement Amid Unsettled Geopolitics
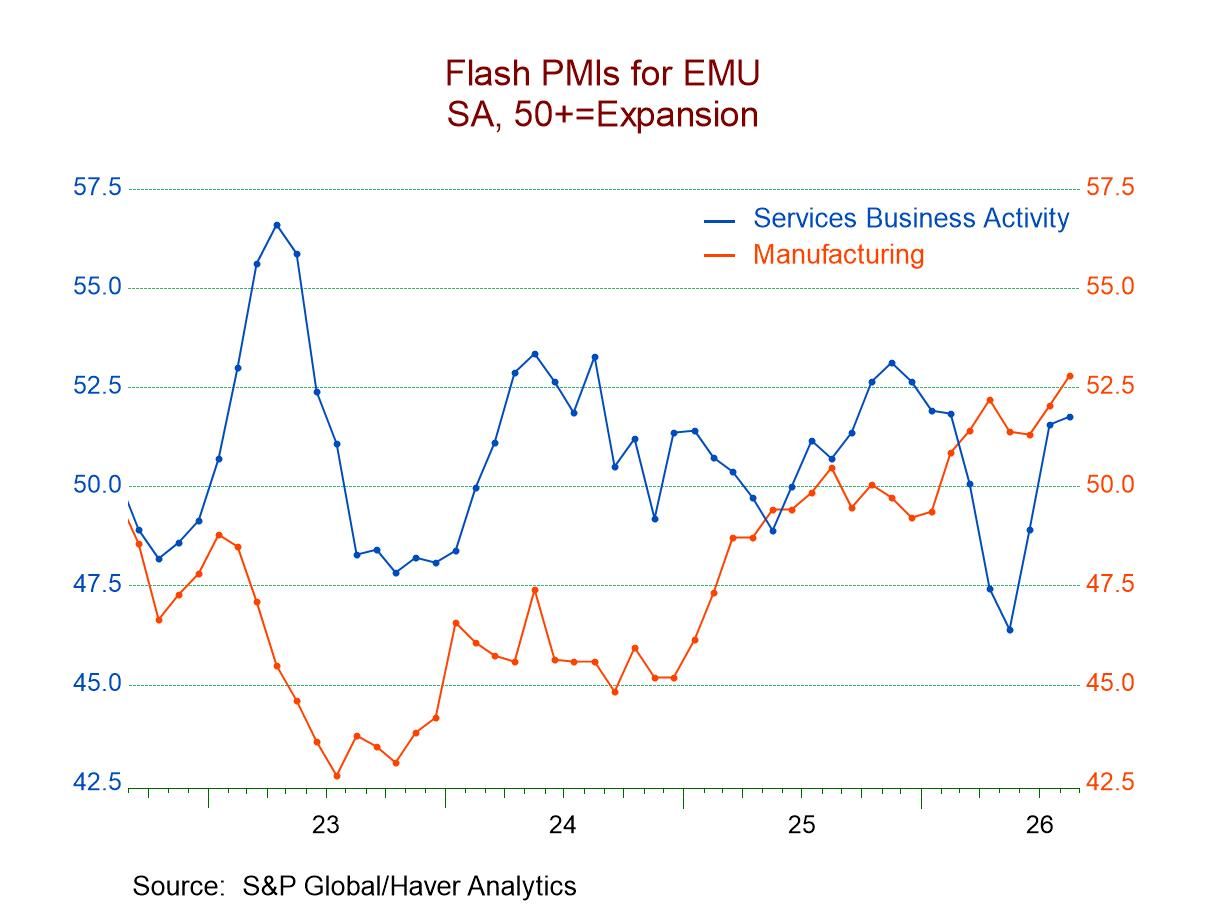
The S&P PMIs show a mixture of strength and weakness in August. However, the readings on average show the composite stronger in August than in July, the manufacturing readings stronger in August than in July, and the services readings slightly stronger in August than in July. That suggests there's broad sectoral improvement underway. However, there's still a great deal of irregularity. The composite indexes rose in five of the eight early reporting countries, with Australia, France, and Germany showing monthly weakening. Despite the weakening in France and Germany, the European Monetary Union showed better conditions on balance. Manufacturing sectors improved in August except for the United States, India, and the United Kingdom. France and Germany also had the only weakening service sectors in August.
Apart from August, the three-month, six-month, and 12-month averages, compiled only on completed data through July, show a bit more weakening. Five countries show composite readings weakening over three months compared to six months, with only the U.S., India, and Australia getting stronger. Over six months, all of the reporters’ composite values are weaker compared with their 12-month values on average, with only Japan getting stronger. For 12 months compared to 12 months ago, all the reporters are stronger and they're stronger on almost all of their readings except for the U.S. The U.S. composite is weaker over 12 months on average, compared to 12 months ago, and its service sector is weaker. The EMU composite is stronger, but the service sector is weaker compared to 12 months ago.
However, in terms of standings, the queue percentile standings for the group are quite good and have been clearly progressing over recent months. The average composite queue standing is in its 60th percentile. For manufacturing, it's in its 63rd percentile, while for services, the average is only in its nearly 49th percentile, just barely below its historic median. Manufacturing PMIs are on a long climb higher. The composite queue readings are dragged down by services, particularly in India but also in Germany and France. The U.K. and Japan have readings above 50 but by the thinnest of margins. The U.S. has a strong service sector by ranking, in its 80th percentile compared to where it's been since 2021. The next strongest ranking is a 69th percentile standing in Australia, and after that, it's a 57th percentile standing in the EMU. The services reading has been in a trendless oscillation since at least mid-2022.
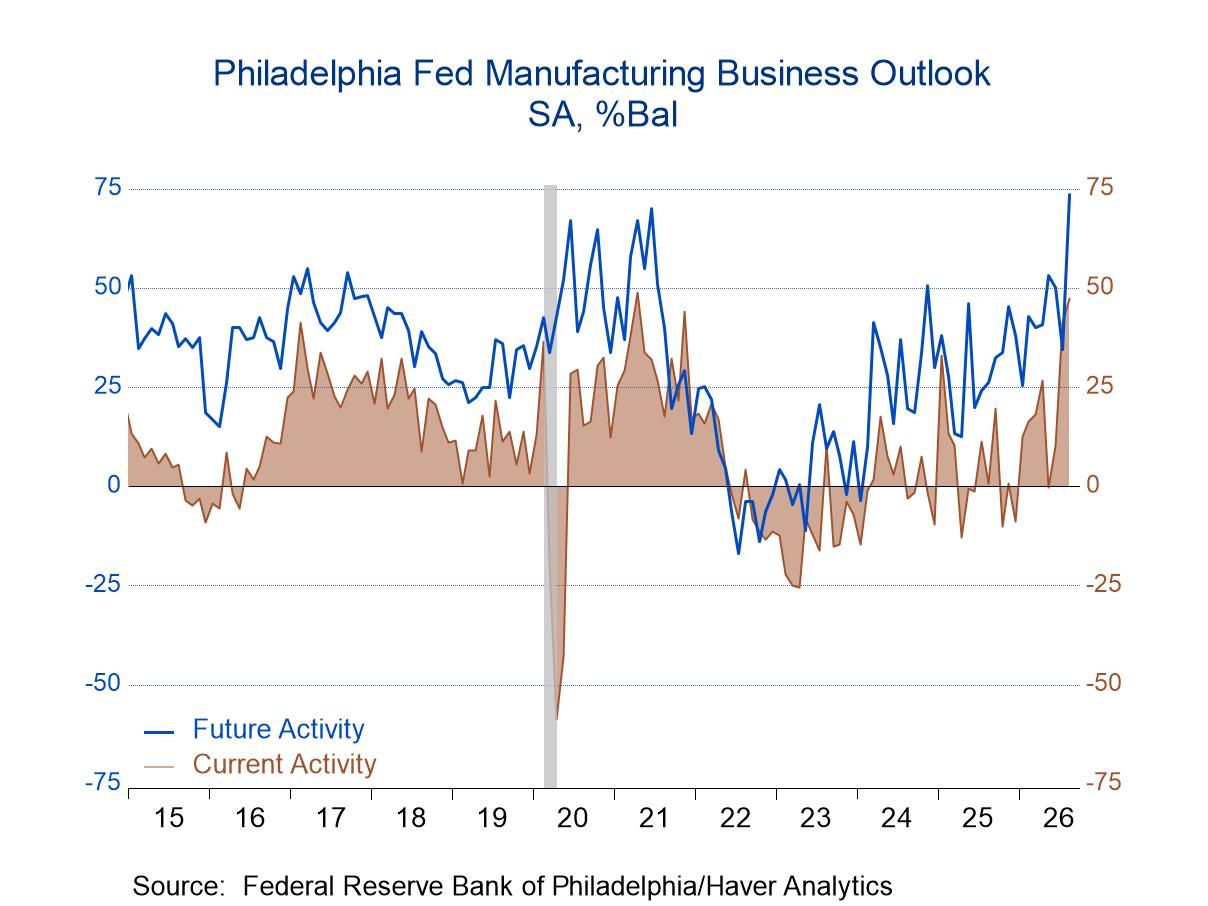
- The headline index increased to 47.4 in August, a five-year high, after having jumped to 41.4 in July. Expectations were for a meaningful decline to 25.0.
- However, the ISM-adjusted index edged down to 57.5 in August from 58.1 in July but was still well above the critical 50 level.
- Price indexes declined in August but remained elevated.
- Delivery times continued to lengthen but at a slower pace than in July.
- The diffusion index for future general activity climbed 39 points to 73.6 this month, its highest reading since August 1983.
by:Sandy Batten
|in:Economy in Brief
 Global| Aug 20 2026
Charts of the Week: The Cost of Capital Climbs
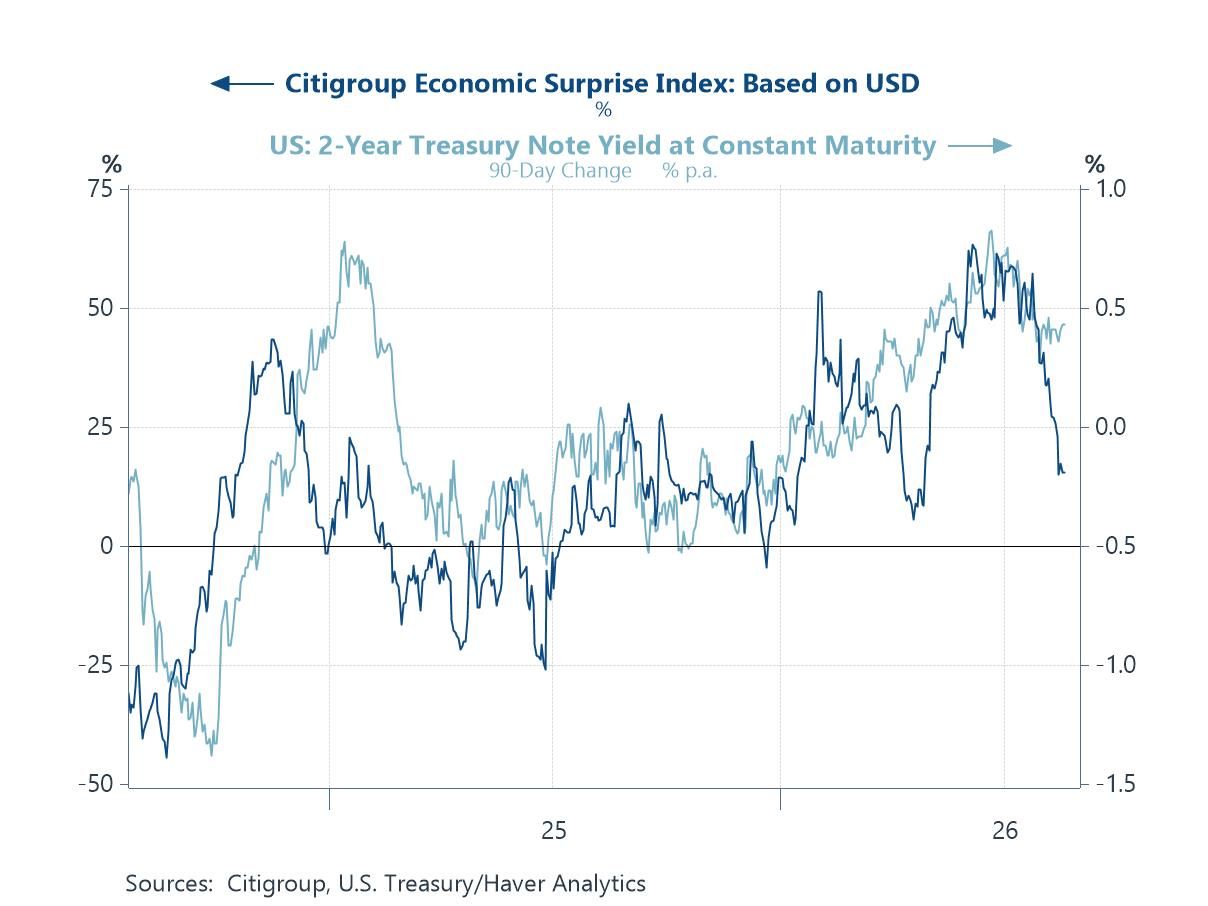
Financial markets have been unsettled this week by a familiar cast of forces, though the balance among them has shifted. Renewed tension in the Middle East has nudged oil prices higher without seriously disturbing the wider tone, while in Japan the yen’s slide to multi-decade lows kept the authorities on intervention watch and the Bank of Japan under pressure to act. But the development that has dominated is the continued climb in long-term interest rates, which across the major economies now stand close to their highest in two decades — a move driven far more by real yields than by any meaningful revival of inflation fears. That the long end should be rising even as disappointing US data have led investors to pare back their expectations of further Federal Reserve tightening — the short end falling as the long end climbs — is a thread running through this week's charts. We begin with that near-term picture: a softening in US data surprises and the accompanying, albeit very modest, easing at the short end of the curve (chart 1), together with the fragile state of domestic demand in Japan that complicates the yen’s defence (chart 2). We then turn to the deeper forces pushing long rates higher. Rearmament is adding a large and largely non-negotiable claim on the public purse, with defence budgets across Europe climbing steeply (chart 3). The flow-of-funds accounts show where the strain comes to rest, with governments across the advanced world in deficit and drawing on a finite pool of saving (chart 4) — saving that is concentrated, more than ever, in China (chart 5). And beneath it all lies the question of whether the investment now under way will deliver the productivity gains needed to justify a higher cost of capital; the latest US figures give little comfort (chart 6).
by:Andrew Cates
|in:Economy in Brief
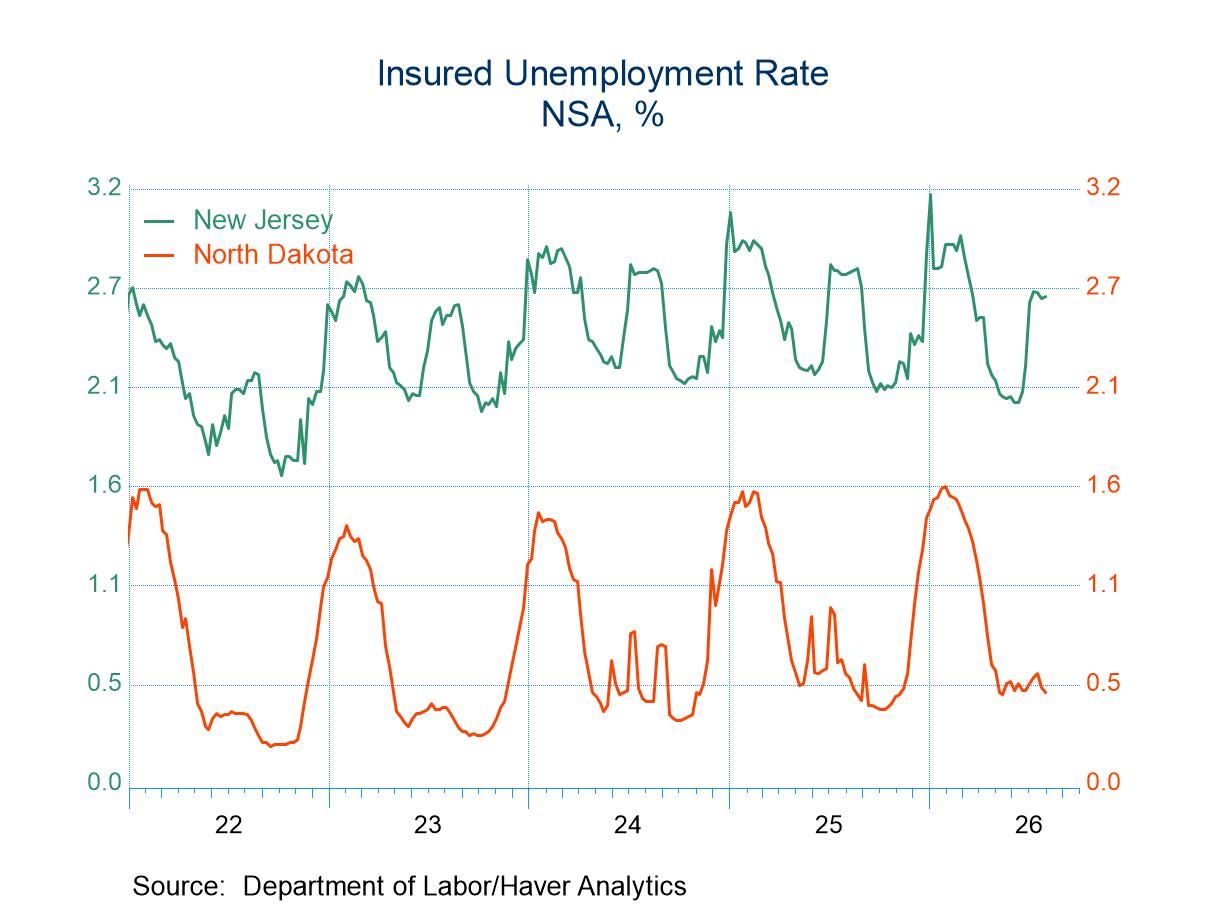
- New claims declined by 6,000 to 206,000 in the week of August 15.
- Continuing claims rose by 18,000 to 1.799 million in the week ending August 8.
- The insured unemployment rate was unchanged at 1.2% in the week of August 8.
 United Kingdom| Aug 20 2026
U.K. Industry Shows Sharp Improvement in CBI Survey
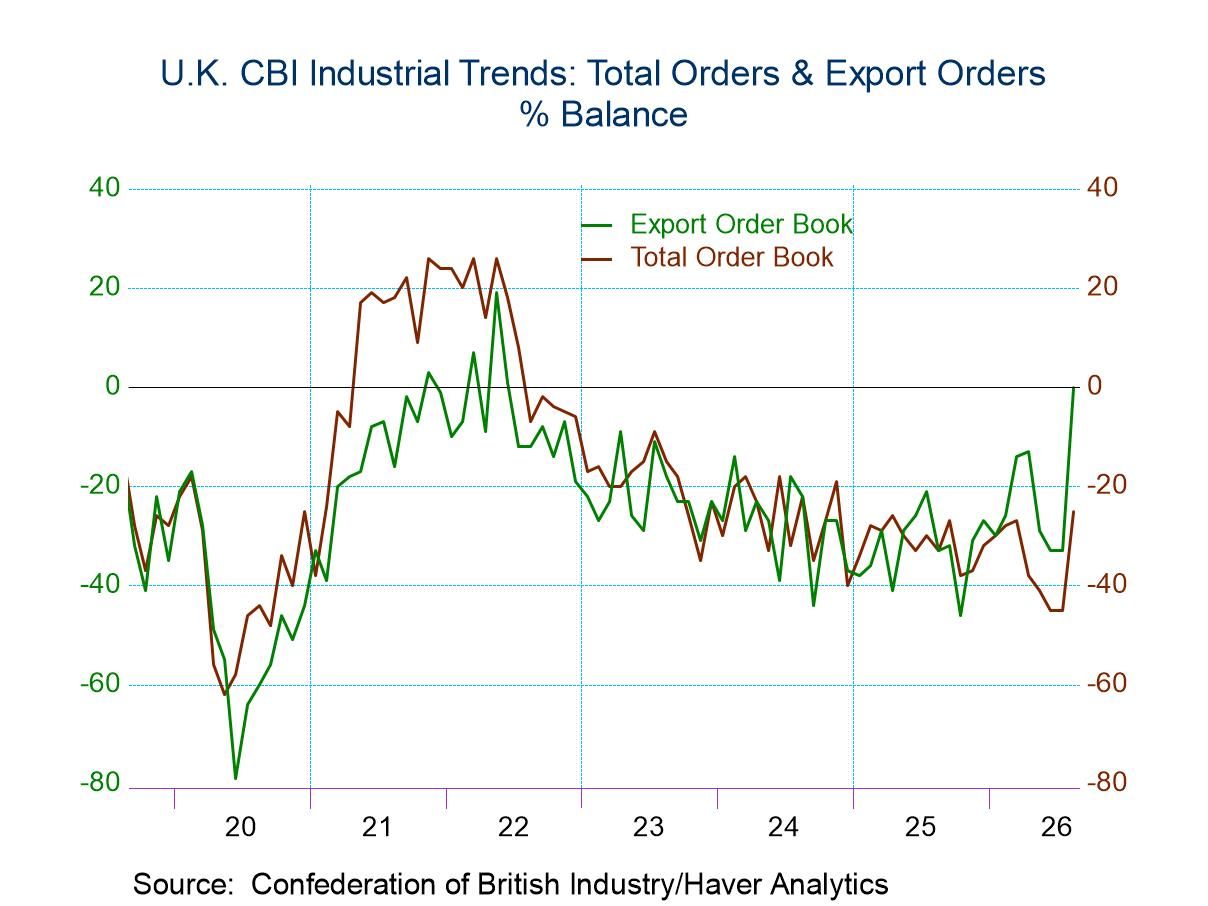
The U.K. CBI (Confederation of British Industry) survey saw orders advance to a diffusion reading of -25 in August from -45 in July. Despite this huge shift, the percentile standing of the August measure is only in its 27th percentile. This ranking emerges after the third largest month-to-month change in the orders reading since late 1993.
In contrast, export orders made their largest monthly change in their month-to-month reading in August, and that boosted the diffusion reading to zero in August from -33 in July. This has impact of boosting the rank or queue standing to its 86.9 percentile, a strong historic standing. We are seeing strong increases in orders in August. These improvements are not always boosting the readings into a zone of strength or even normalcy, but they have taken the readings out of the extreme weak tails of their respective distributions.
Looking ahead... The output volume diffusion reading, looking ahead to the next three months, improved to -7 in August from -30 in July. The month-to-month change in the reading is the seventh largest back-to-back improvement in that series. The expected output reading, however, is still only in its 16th percentile despite the extremely large monthly change.
On the other hand, the price expectations jumped to 22 in August from 11 in July, logging the 19th largest month-to-month increase, again on data back to late 1993. Average prices rank in their 84th percentile. So, their recent sizeable rise has pushed them up to the high distribution levels. Manufacturing output, which lags the CBI survey, is still much weaker and draws from a weaker period, judging from the CBI readings.
Growth seems to have picked up, but unfortunately so has inflation. The U.K. CPI-H measure rose by 0.6% m/m in July. It is now on an accelerating plane from 3.1% over 12 months to 3.4% annualized over six months to an annual pace of 3.7% over three months. Core inflation has been excessive and has popped over three months.
The U.K. situation remains a difficult one. Economic growth has not been very good. The party leader and labor party PM recently stepped down and has been replaced. Inflation has been excessive for a while. Despite deflating, inflation is moving back up again, and despite the unwind, it did not get back to 2% when it eased.
The pick-up in the CBI index is encouraging, but it is coming with increased price pressures. Relatively more of the improvement in orders is from exports, so the domestic economy is not looking like it will generate much in the way of sustainable inflation. A lot of inflation is still coming from energy, and no one really knows how to handicap that.
- of7Go to 2 page