 Global
CNTRADE → Motor Vehicle Exports
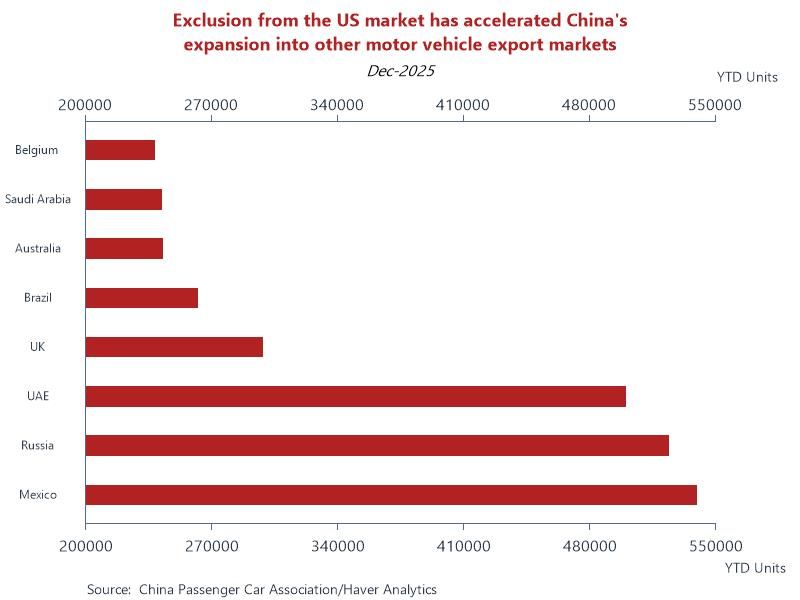
Motor vehicle exports detail for China was added to the CNTRADE database. These data, reported in number of vehicles, are available for 21 of China’s motor vehicle export markets. Monthly data are sourced from the China Passenger Car Association and start in April 2024.
Chart: China is currently the world’s largest exporter of motor vehicles. Exports have increased by multiple factors, from under 1 million in 2020 to around 8 million in 2025, essentially increasing 7-8 times over 5 years. In 2025, the top countries importing cars from China were Mexico, Russia, and the UAE, with Mexico importing over 539,000 units. US tariffs and other restrictions have forced Chinese automakers to pivot, driving a massive surge in vehicle exports to alternative markets in Europe, Latin America, SE Asia and the Middle East.