 Global| Jun 03 2026
Featured Data Additions, June 3, 2026
USECON → Business Cycle Indicators and Surveys → Supply Chain Bottleneck Sentiment
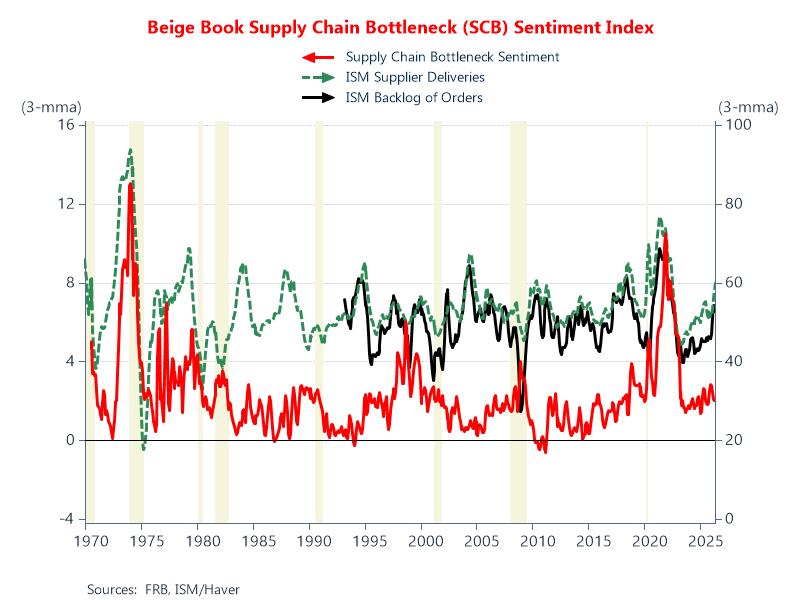
The Supply Chain Bottleneck (SCB) Sentiment index was added to USECON. This index utilizes unsupervised machine learning and natural language processing techniques to identify words related to supply chain bottlenecks in the Federal Reserve's Beige Book and uses deep learning to account for the sentiment of the identified supply chain text. Monthly data are sourced from the FRB and start in May 1970.
Chart: Supply chains were stressed after the 1973 OPEC embargo and the 1979 increases in oil prices resulting from the Iranian Revolution. More recently, bottlenecks arose during the COVID-19 pandemic due to global factory slowdowns, shifts in consumer demand and severe labor shortages. The index suggests that the bottlenecks arising from the pandemic started declining in the latter half of 2021. This is in line with other measures of supply chain bottlenecks, such as the ISM supplier delivery times and order backlogs indexes.
CRYPTO → Reserve Report (Underlying Assets Detail) → Tether
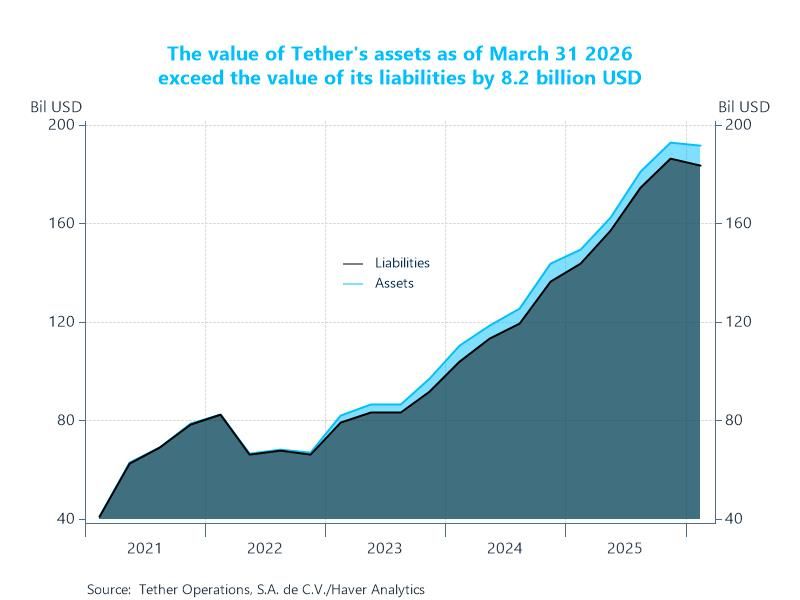
The reserves report for the Tether stablecoin was added to the CRYPTO database. All Tether tokens are pegged at 1-to-1 with a matching fiat currency and are backed 100% by Tether’s Reserves. This report is published on a quarterly basis and includes detail on Tether’s asset holdings, liabilities and equity. Data start in Q1 2021.
Chart: As of March 31 2026, the reserves for Tether tokens in circulation amount to 191.8 billion USD. The liabilities of the company amount to 183.5 billion USD, thus demonstrating that the reserves are greater than the redemption value of Tether tokens in circulation by 8.2 billion USD. In terms of asset composition, 73.6% consists of cash/cash equivalents/other ST deposits, of which 82.9% are US Treasury bills. Precious metals make up an additional 10.3% of total assets.
ESG → Societal Vulnerability and Risks → Natural Disasters → Economic Damage as a Percent of GDP by Country
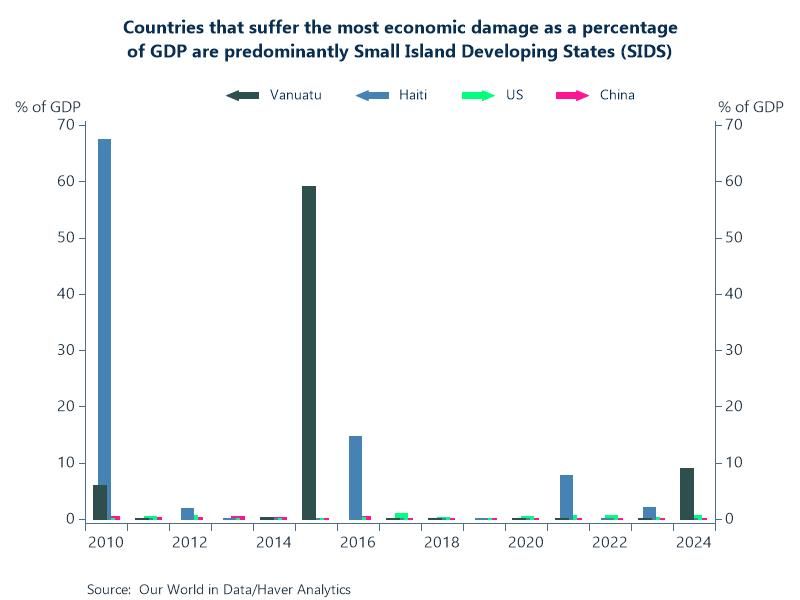
Economic damage from natural disasters as a percent of GDP statistics were added to ESG. Natural disasters include all geophysical, meteorological and climate events such as earthquakes, volcanic activity, landslides, drought, wildfires, storms and flooding. Series are available for approximately 200 countries and aggregates. Annual data are sourced from Our World in Data and start as early as 1910.
Chart: Countries that suffer the most economic damage as a percentage of GDP are predominantly small island nations such as Vanuatu and Haiti. Because of their smaller economies and high exposure to extreme weather, a single disaster can wipe out a large proportion of these countries' annual economic output. While countries like the US and China suffer the highest absolute dollar losses, their large, diversified economies absorb these shocks better, keeping damage to a small percent of their respective GDPs.
JAPANR → Housing and Construction → Trends in National Market for Condominiums
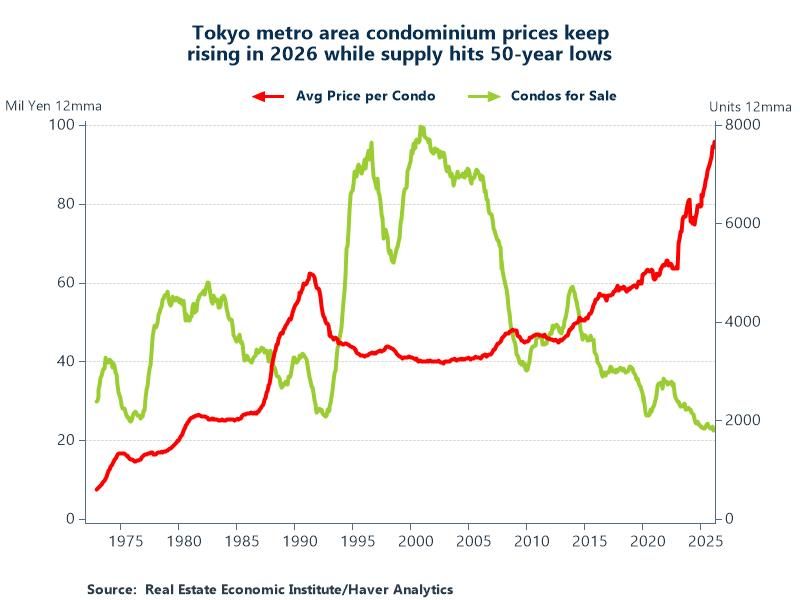
Trends in the condominium market for Japan were added to the JAPANR database. Concepts include metrics for supply, purchases, prices and area in square meters for condominiums in the Tokyo and Kansai metropolitan areas along with surrounding prefectures. Monthly data are sourced from the Real Estate Economic Institute and start in January 1972.
Chart: On a 12-month moving average basis, the average new condominium price in the Tokyo metro area reached a record ¥95.8 million in April 2026, up 17.2% year-on-year. Prices are setting records in every surrounding prefecture as well. Supply has been steadily decreasing for four straight years and is currently at 50-year lows. Three main factors explain the shortage: limited central land, higher construction costs, and tighter labor rules that slow down projects.
More Featured Data Additions
 Global| May 27 2026
Featured Data Additions, May 27, 2026
 Global| May 20 2026
Featured Data Additions, May 20, 2026
 Global| May 15 2026
Featured Data Additions, May 15, 2026
 Global| May 06 2026