

- Electricity supply statistics for Bhutan were added to the ENERGY database.
- Tax, social security and customs revenue statistics for Argentina were added to the EMERGELA database.
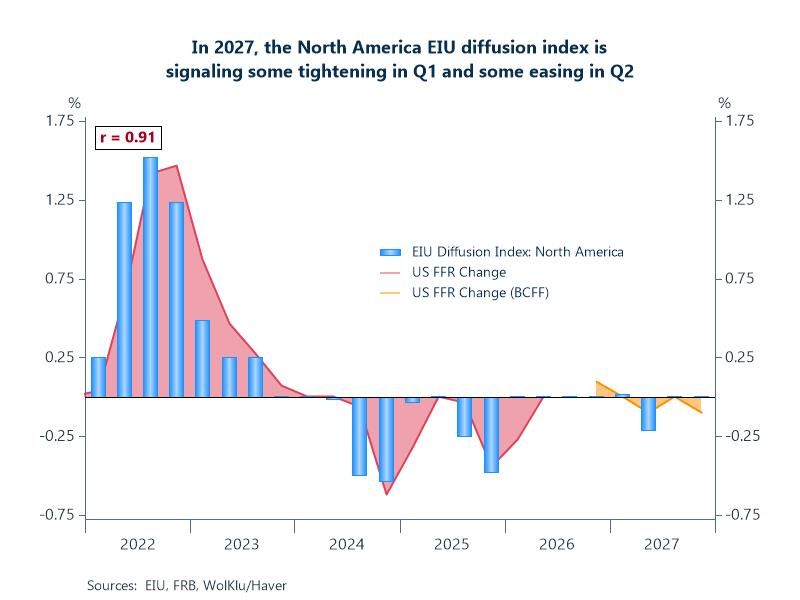
- Monetary policy diffusion indexes were added to EIURSKF.
 Global| Sep 23 2026
Featured Data Additions, September 23, 2026
 Global| Sep 18 2026
Featured Data Additions, September 18, 2026
- Fuel prices for Myanmar were added to the ENERGY database.
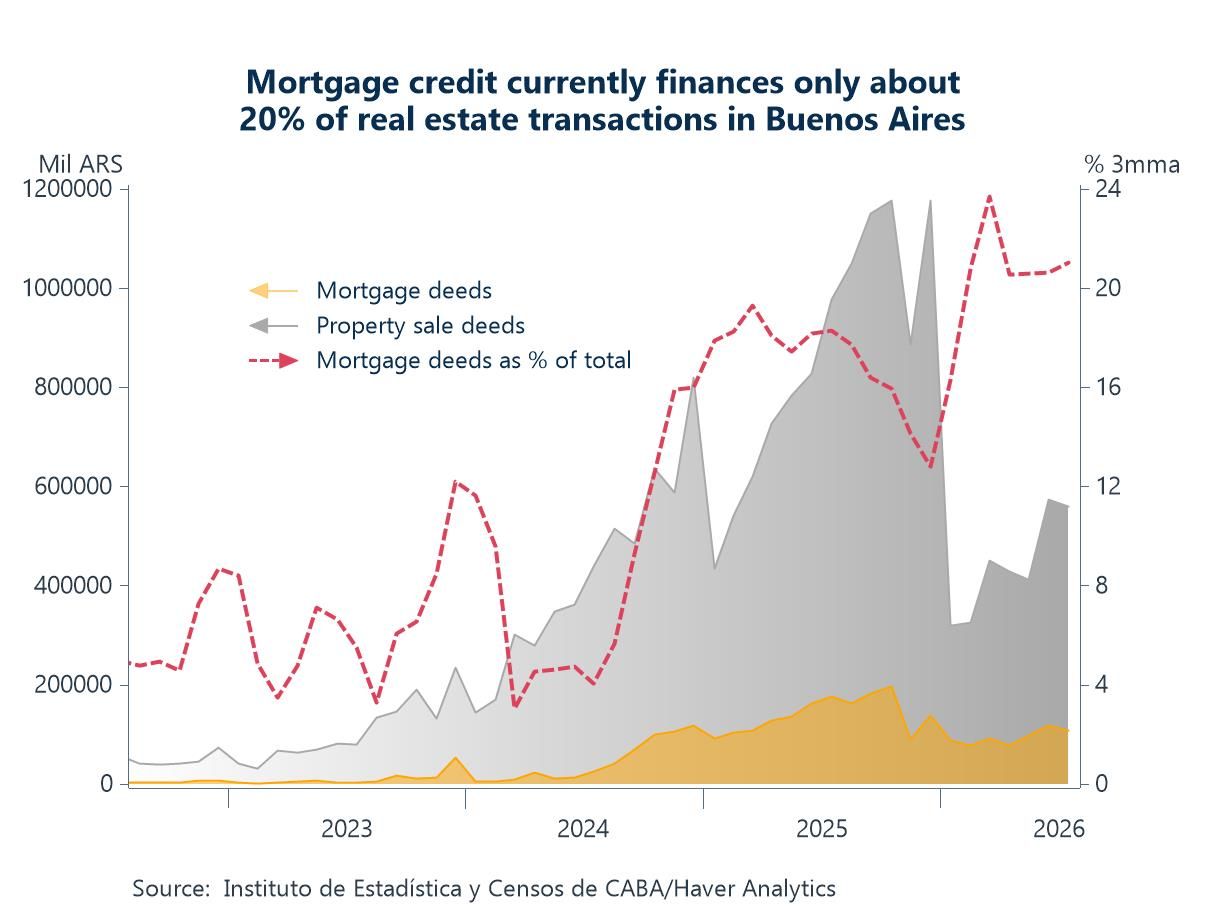
- Property sale and mortgage deeds statistics for the city of Buenos Aires were added to EMERGELA.
- Labor underutilization indicators for South Korea were added to EMERGEPR.
 Global| Sep 02 2026
Featured Data Additions, September 2, 2026
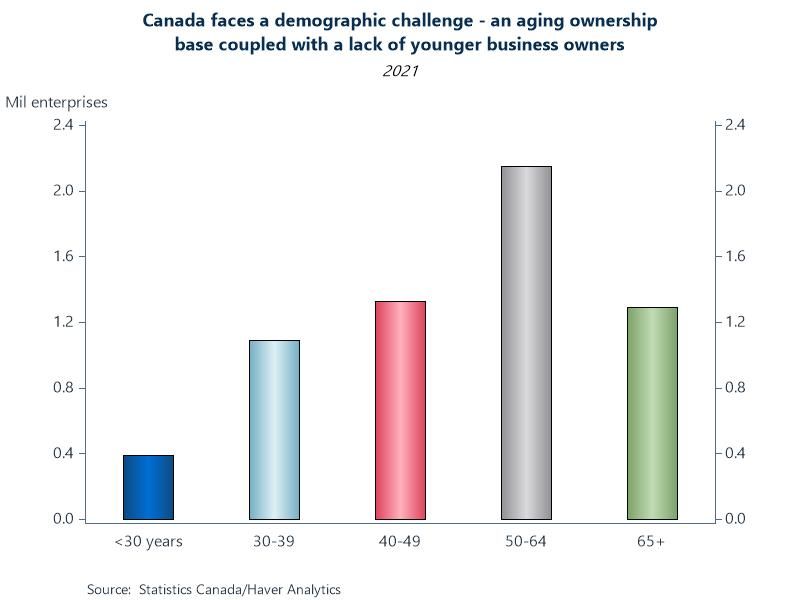
- Number of enterprises by age of owner and revenue threshold for Canada were added to CANADA and CANADAR.
- Public transportation ridership data for Madrid was added to the TRANSPRT database.
- Retail fuel prices for Latvia were added to the ENERGY database.
 Global| Aug 27 2026
Featured Data Additions, August 27, 2026
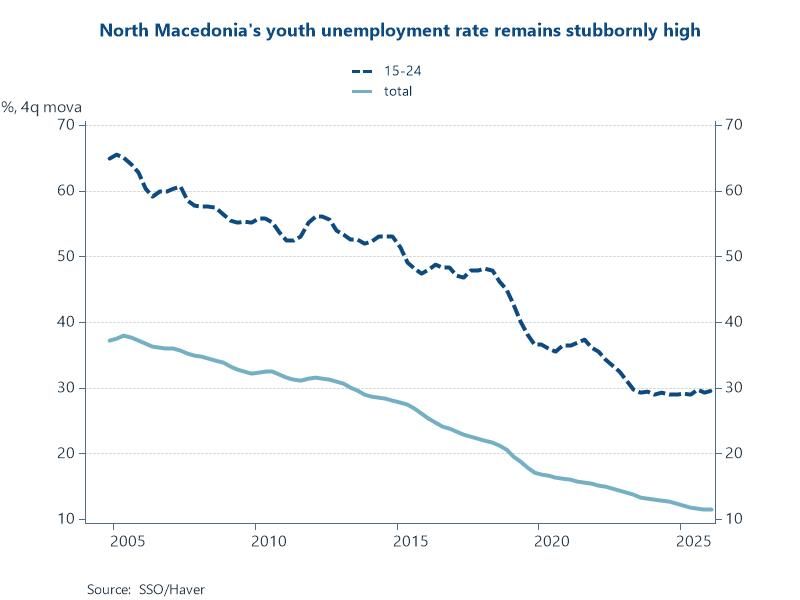
- Additional labor force statistics by age group and sex for North Macedonia were added to the EMERGECW database.
- Central government public debt statistics for Uzbekistan were added to EMERGECW.
- A Danube River water level series for Hungary was added to GLSECTOR, INTDAILY, ENERGY and TRANSPRT.
 Global| Aug 19 2026
Featured Data Additions, August 19, 2026
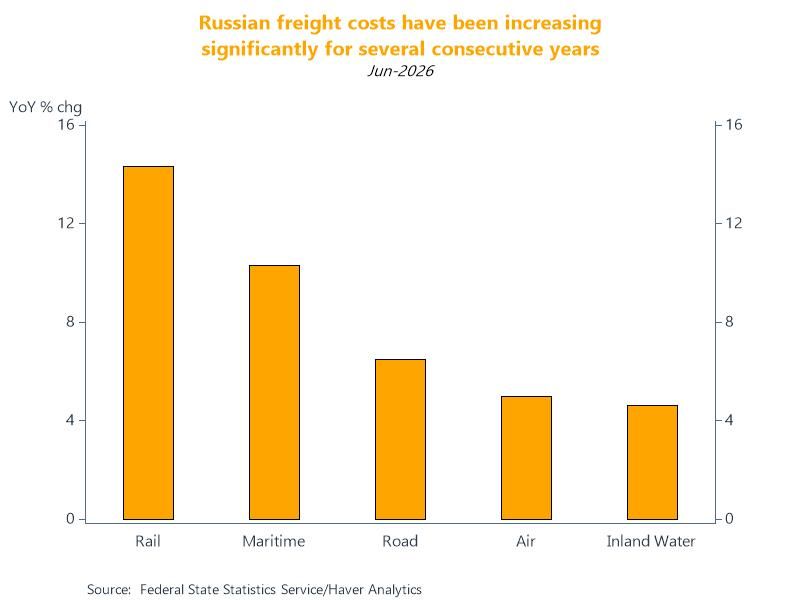
- Freight transport cost statistics for Russia were added to the TRANSPRT database.
- We expanded our metal prices offering sourced from Shanghai Metals Market in the CMDTY database.
- Motor vehicle registration statistics by class of vehicle and fuel type for Singapore were added to the TRANSPRT database.
 Global| Aug 11 2026
Featured Data Additions, August 11, 2026
GLSECTOR → Artificial Intelligence → Artificial Intelligence Use in Enterprises
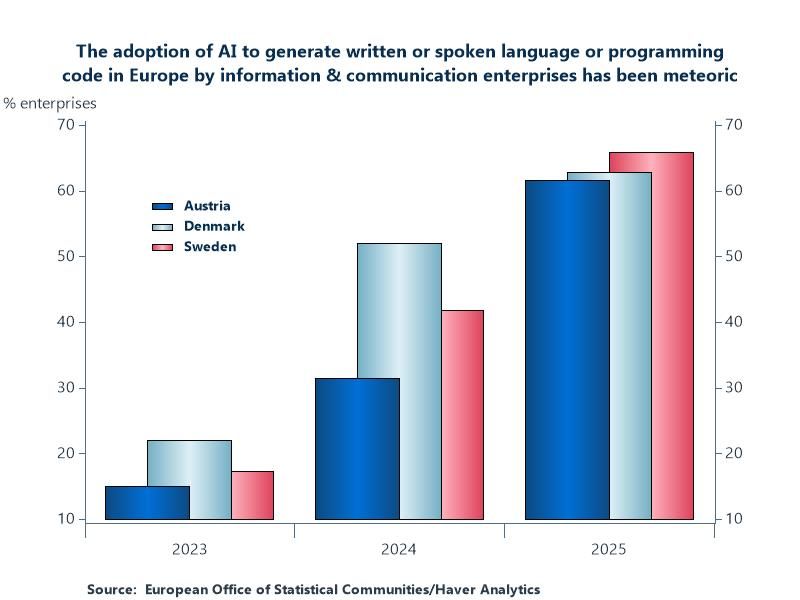
Almost 78,000 series relating to AI use in European enterprises have been added to GLSECTOR. Coverage includes data for the EU, EA and 34 individual countries. Data are available by sector with detail by type of AI technology, purpose of use, source of the AI, reasons for not using AI, digital intensity metrics and AI use on individuals. Annual data are sourced from Eurostat and start in 2021.
Chart: The adoption of AI to generate written or spoken language or programming codes in Europe by information & communication enterprises has been meteoric. In Austria, Denmark and Sweden – some of the top adopters – use has risen by 46, 41 and 49 percentage points, respectively, since 2023. Approximately one third of European countries covered are above 50% usage in 2025. The euro area’s information & communication enterprises as a whole are showing 43% adoption in 2025.
 Global| Aug 05 2026
Featured Data Additions, August 5, 2026
TOURISM → Countries and Special Areas Listed Alphabetically → Maldives → Tourist Arrivals
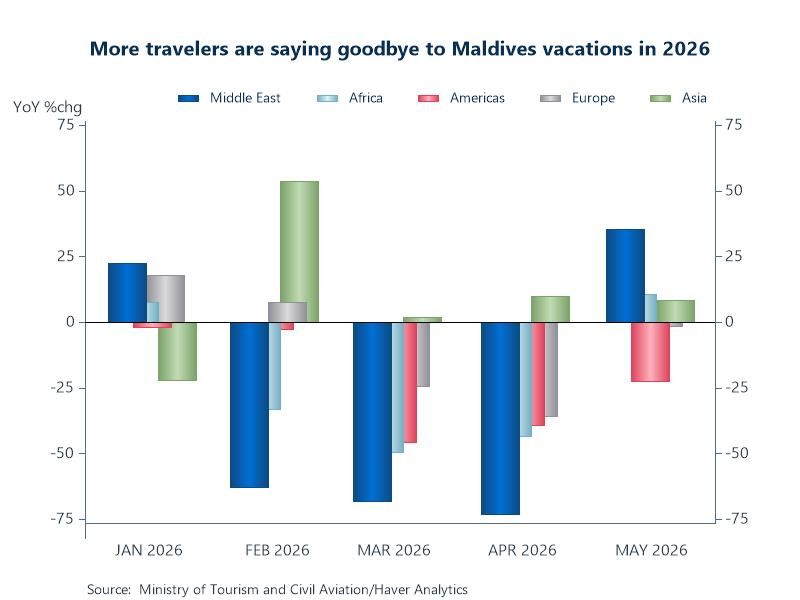
Tourist arrival detail for the Maldives was added to the TOURISM database. Tourist arrivals from 80 individual countries and 15 world regions are available on this table. Monthly data are sourced from the Ministry of Tourism and Civil Aviation and start as early as January 1988.
Chart: The Maldives has spent years cementing its reputation as one of the world's premiere luxury tropical destinations and has seen increasing tourist arrivals since the end of the pandemic. However, 2026 tells a different story with significant double-digit YoY decreases from most world regions. Ongoing instability in the Middle East has continued to ripple across global flight networks – and because many travelers reach the Maldives through Middle Eastern hubs, disruptions, rerouted flights, and higher fuel costs make the journey more complicated, expensive and thus less appealing.
 Global| Jul 29 2026
Featured Data Additions, July 29, 2026
EMERGEMA → Uganda → International Trade and Balance of Payments → Diaspora Remittance by Country
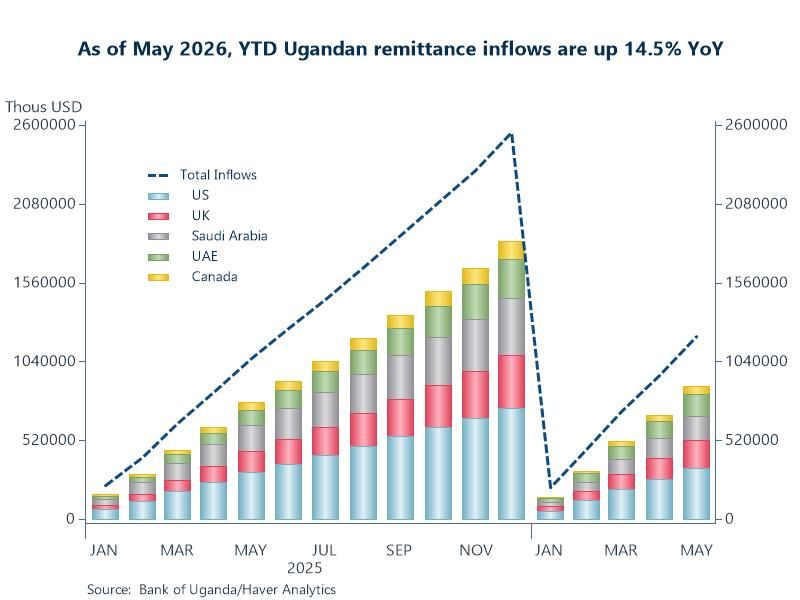
Remittance statistics for Uganda were added to the EMERGEMA database. This data set includes inflows and outflows reported in USD in addition to the number of transactions for each. Totals plus detail for 240 countries and territories are included on this table. Monthly data are sourced from the Bank of Uganda and start in January 2025.
Chart: Remittances are a critical pillar of the Ugandan economy, representing one of its largest sources of foreign exchange. These inflows act as a social protection system for millions of Ugandans, particularly the unemployed youth and the elderly. Inflows reached 2.6 billion USD in 2025, which is equivalent to approximately 3.8% of the country's GDP. Through May 2026, YTD remittances were up 14.5% YoY – where 70-75% consistently originates from the US, UK, Saudi Arabia, UAE and Canada.
- of6Go to 1 page