

 Global| Jul 29 2026
Featured Data Additions, July 29, 2026
EMERGEMA → Uganda → International Trade and Balance of Payments → Diaspora Remittance by Country
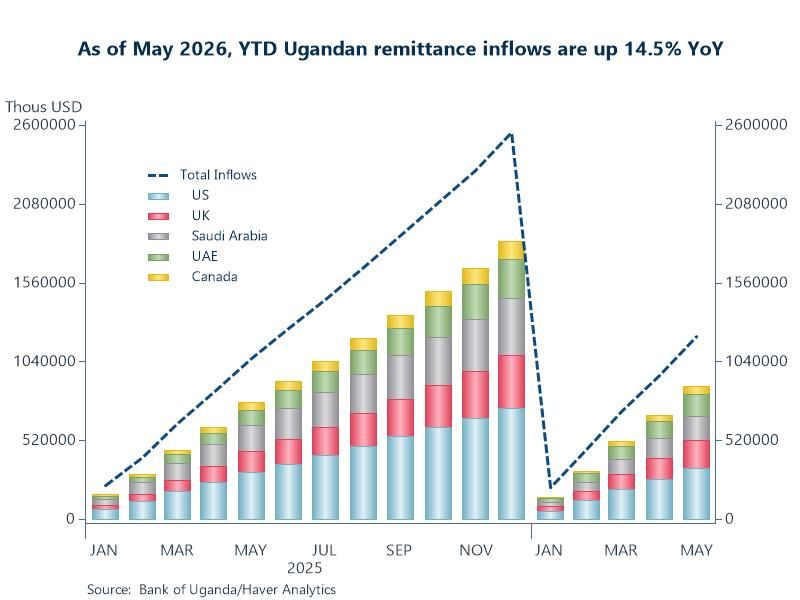
Remittance statistics for Uganda were added to the EMERGEMA database. This data set includes inflows and outflows reported in USD in addition to the number of transactions for each. Totals plus detail for 240 countries and territories are included on this table. Monthly data are sourced from the Bank of Uganda and start in January 2025.
Chart: Remittances are a critical pillar of the Ugandan economy, representing one of its largest sources of foreign exchange. These inflows act as a social protection system for millions of Ugandans, particularly the unemployed youth and the elderly. Inflows reached 2.6 billion USD in 2025, which is equivalent to approximately 3.8% of the country's GDP. Through May 2026, YTD remittances were up 14.5% YoY – where 70-75% consistently originates from the US, UK, Saudi Arabia, UAE and Canada.
EMERGEFM → Eswatini → Production → Mineral Production
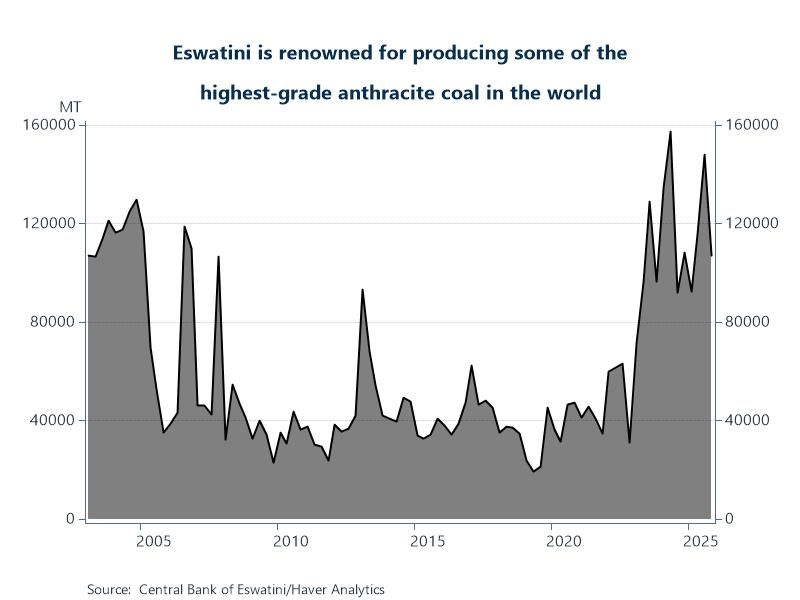
Mineral production statistics for Eswatini were added to the EMERGEFM database. Metrics for coal, quarried stone, iron ore and gold are available on this table. Quarterly data are sourced from the Central Bank of Eswatini and start in Q1 2003.
Chart: Despite having a relatively minor overall mining sector, Eswatini boasts a leading regional output of anthracite coal, which accounts for roughly 1% of global coal reserves. Anthracite is a highly valued grade of coal used extensively in the production of iron and steel. Eswatini mined 463k MT of anthracite coal in 2025 – down 5.9% from 2024, but up 321% since 2019. Almost all of it is exported to neighboring South Africa where it is primarily used as a specialized fuel in the metallurgical and steel industries.
CANADA → Prices → Freight Rail Services Price Index
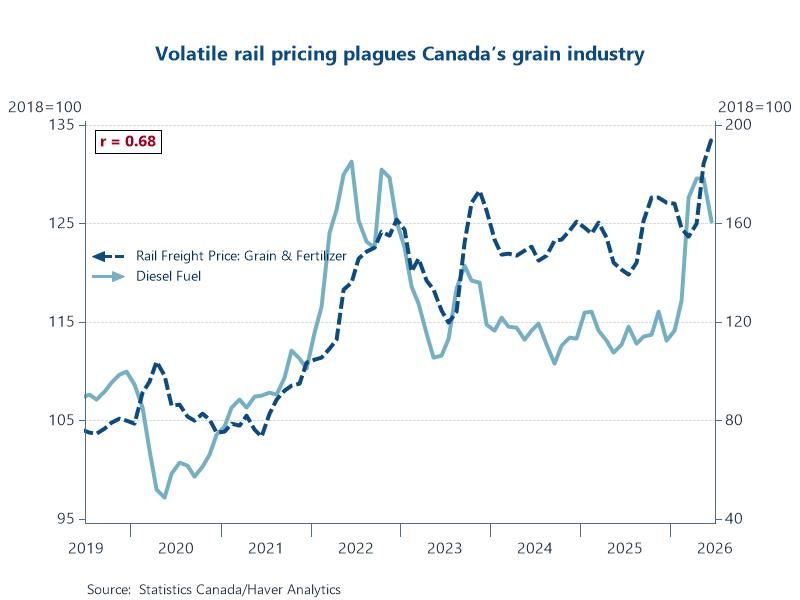
The Freight Rail Services Price Index (FRSPI) has been added to the CANADA database. The FRSPI measures the changes in prices of shipments of commodities by the freight rail industry and is quality adjusted for service changes. Detail is available for forest products, grain & fertilizer, intermodal, metals & minerals and petroleum & chemicals. Monthly data are sourced from Statistics Canada and start in January 2018.
Chart: Global geopolitical tensions have spiked the price of diesel and since rail fuel surcharges are directly tied to diesel prices, grain shippers are seeing increases in shipping costs. Since March, the cost of moving grain in rail cars across Canada has increased by 8%. The y/y increase is even greater at 13%. Grain companies lock in sales months in advance, which leaves them exposed to freight increases that arrive after contracts are signed. These sudden hits to the margin affect the bottom line.
More Featured Data Additions
 Global| Sep 18 2026
Featured Data Additions, September 18, 2026
 Global| Sep 02 2026
Featured Data Additions, September 2, 2026
 Global| Aug 27 2026
Featured Data Additions, August 27, 2026
 Global| Aug 19 2026