 Global| Jun 30 2026
Featured Data Additions, June 30, 2026
INSECTOR → Other Nonmetallic Mineral Products → Cement Production
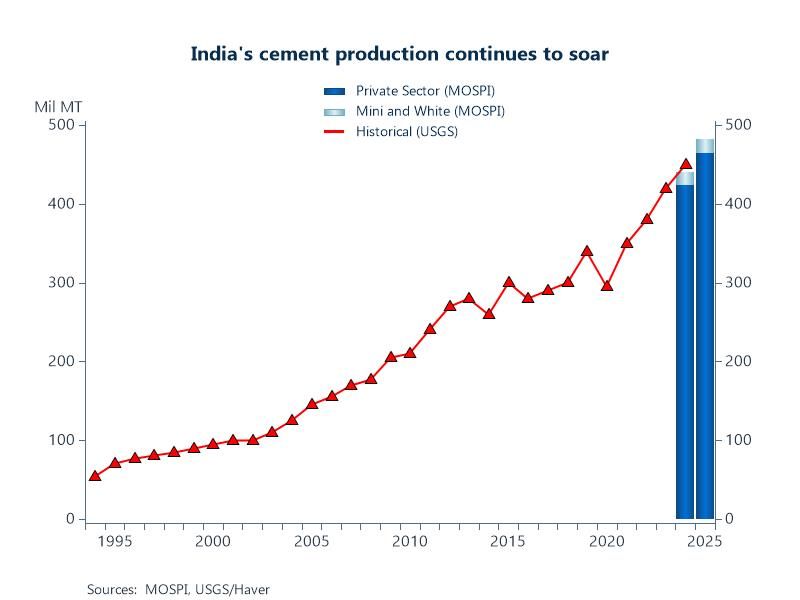
Cement production data for India were added to the INSECTOR database – Haver’s database for detailed Indian sector statistics. Detail is available for the public and private sectors, mini cement plants, and white Portland cement operations. Monthly data are sourced from the Ministry of Statistics and Programme Implementation and start in June 2023.
Chart: India is the second largest cement producer in the world behind China, and accounts for 12.4% of global output. Production has been soaring, recording a 10.5% increase YoY in January and averaging 8% annual growth since 1995. Growth has been driven by surging urbanization, sustained government capital expenditure on mega-infrastructure projects, and the relaxation of government controls (which spurred massive private capacity expansion).
ENERGY → Country-Sourced Statistics → China → Gas Consumption
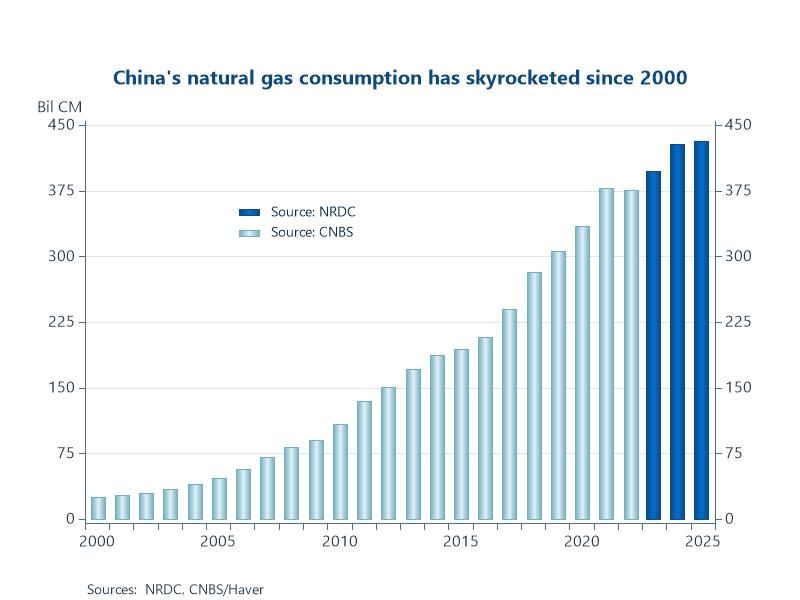
Natural gas consumption statistics for China were added to the ENERGY database. These monthly series complement the annual data available from the China National Bureau of Statistics (CNBS) and allow for more current consumption insights. Monthly levels, YTD series, and growth rates are included on this table. Data are sourced from the National Development and Reform Commission (NDRC) and start in September 2022.
Chart: China's natural gas consumption has skyrocketed since 2000, growing from roughly 25 billion cubic meters (bcm) to an estimated 431 bcm in 2025. This transformation has been driven by rapid economic development, massive infrastructure builds, and government initiatives to replace coal to reduce air pollution. However, consumption outpaces local extraction, making China one of the world's largest importers of both pipeline gas and LNG.
AGRI → Australia → Livestock Slaughtered
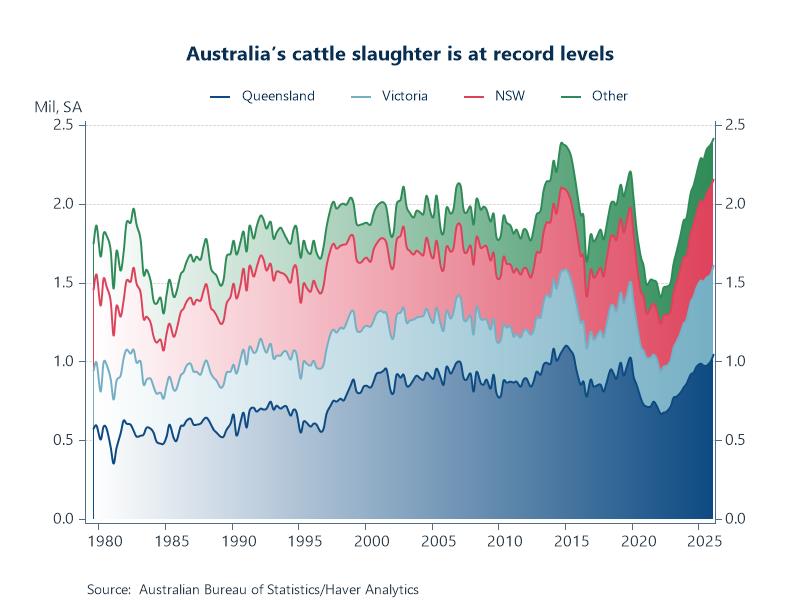
Livestock statistics for Australia were added to the AGRI database. Available concepts include livestock slaughtered in units, gross value of livestock slaughtered, and meat produced in MT. Detail is available by type of animal and by region. Quarterly and annual adjusted and unadjusted data are sourced from the Australian Bureau of Statistics and start as early as 1972.
Chart: Australia’s cattle slaughter is currently at record levels, registering 2.4 million head in Q1, driven by a stark regional divide. Persistent and severe dry conditions have hit major southern producing states, particularly NSW and Victoria. Confronted with dwindling feed and water, southern producers are being forced to offload their stock resulting in slaughter levels at or near all-time highs. Conversely and despite destocking in the south, favorable seasonal conditions and solid pasture growth across Queensland in the north is keeping cattle availability high, and thus slaughter rates.
More Featured Data Additions
 Global| Jun 26 2026
Featured Data Additions, June 26, 2026
 Global| Jun 17 2026
Featured Data Additions, June 17, 2026
 Global| Jun 12 2026
Featured Data Additions, June 12, 2026
 Global| Jun 03 2026