 Global| Jun 17 2026
Featured Data Additions, June 17, 2026
UKR → Bermuda → National Accounts → GDP by Expenditure
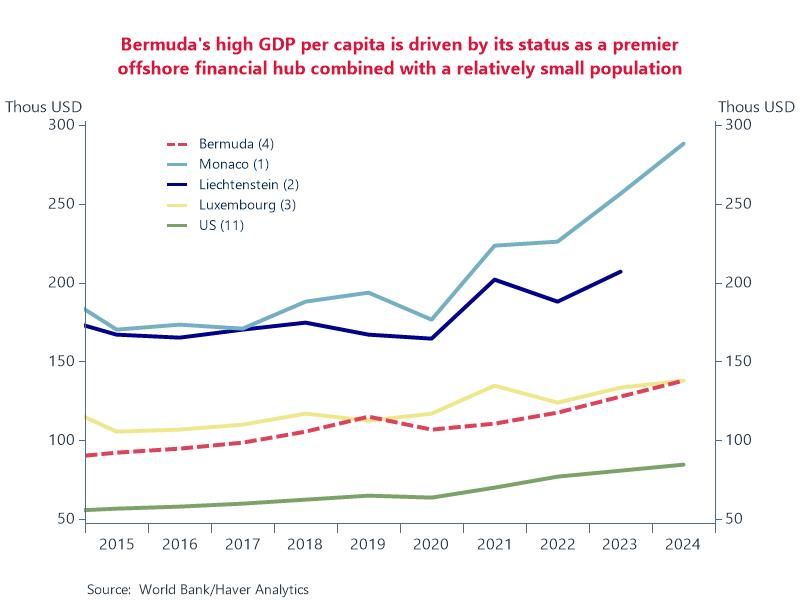
GDP by expenditure for Bermuda was added to UKR, as we continue to add content for this British Overseas Territory in the North Atlantic. Some detail for consumption, gross capital formation and foreign trade is available in current and constant dollars. Quarterly data are sourced from the Government of Bermuda and start in Q1 2014.
Chart: Of interest regarding Bermuda’s GDP is its claim to one of the highest GDP per capita metrics in the world – currently registering at over $137k per resident. Only Monaco, Liechtenstein and Luxembourg can boast higher. Bermuda's exceptionally high rank is driven by its status as a premier offshore financial hub - and because it has virtually no corporate or personal income tax, it attracts thousands of international companies that generate enormous economic output on paper combined with a relatively small population of ~64,000.
EMERGEMA → Qatar → Employment and Earnings → Economically Active Population by Occupation
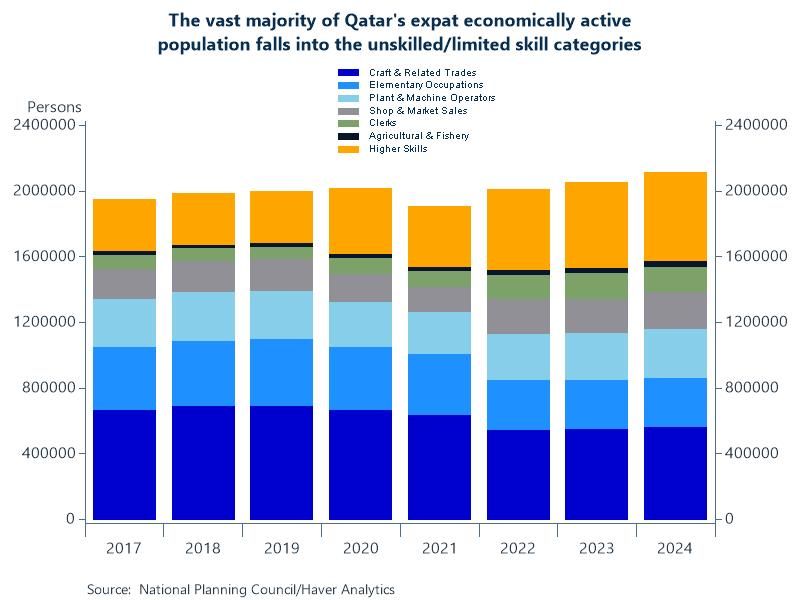
Additional detail for Qatar's economically active population has been added to EMERGEMA. The table offers a breakdown of the economically active population (15 years and older) by occupation, gender and nationality (Qatari vs Non-Qatari). Annual data are sourced from the National Planning Council and begin in 2017.
Chart: Qatar's economically active population is defined by its expat dominance where non-Qataris represent approximately 94% of the total. Expats are primarily concentrated in construction, craft trades, domestic work, and other unskilled or limited skill occupations while 60% of Qatari citizens work in highly skilled professional, managerial, and public administration roles vs 25% of expats working in comparable roles, however, this is up from 16% only five years ago.
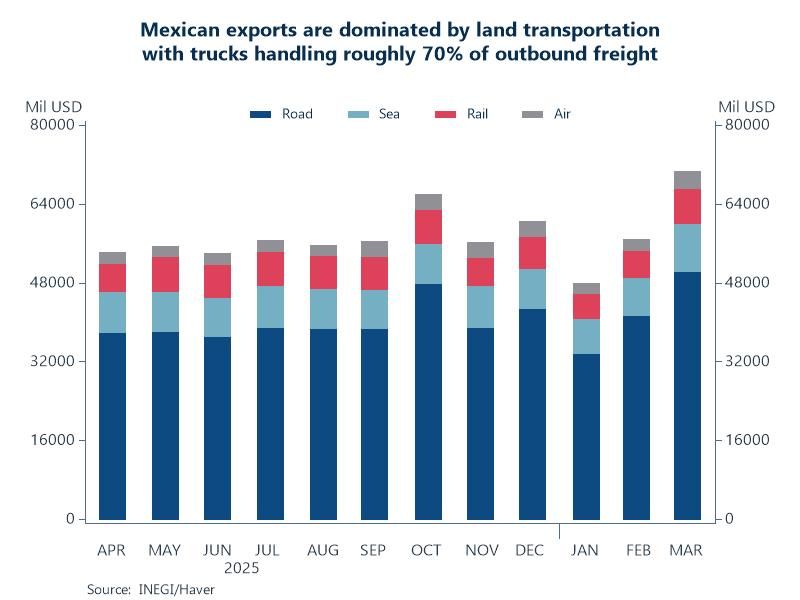
CANADA → International Trade → Merchandise Trade by Principal Trading Partner and Mode of Transport
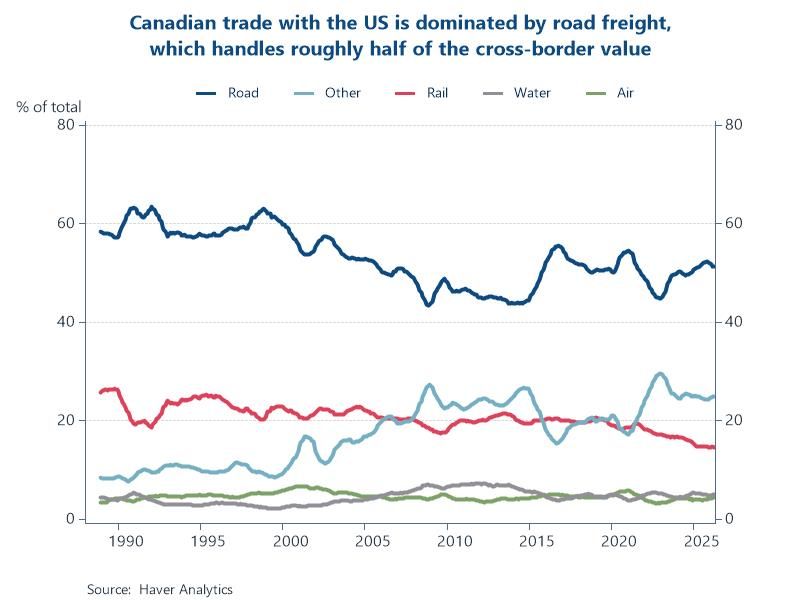
Merchandise trade by mode of transport for Canada was added to the CANADA database. Available modes of transport include by road, rail, water, air, and other. Other includes mostly pipeline cross-border trade. These value data in CAD are available for 27 of Canada’s principal trading partners. Monthly data are sourced from Statistics Canada and start in January 1988.
Chart: Canada-US trade is dominated by trucking, which handles more than half of cross-border value. Rail handles about 14% of export value but accounts for 50% of tonnage (mainly bulk raw materials). Maritime and air freight are generally reserved for specific types of trade. Pipelines transport massive volumes of energy products and have an inverse relationship with road transport – most movements can be directly tied to pipelines coming online or fluctuations in energy prices.
More Featured Data Additions
 Global| Jun 12 2026
Featured Data Additions, June 12, 2026
 Global| Jun 03 2026
Featured Data Additions, June 3, 2026
 Global| May 27 2026
Featured Data Additions, May 27, 2026
 Global| May 20 2026