

 Global| Aug 11 2026
Featured Data Additions, August 11, 2026
GLSECTOR → Artificial Intelligence → Artificial Intelligence Use in Enterprises
Almost 78,000 series relating to AI use in European enterprises have been added to GLSECTOR. Coverage includes data for the EU, EA and 34 individual countries. Data are available by sector with detail by type of AI technology, purpose of use, source of the AI, reasons for not using AI, digital intensity metrics and AI use on individuals. Annual data are sourced from Eurostat and start in 2021.
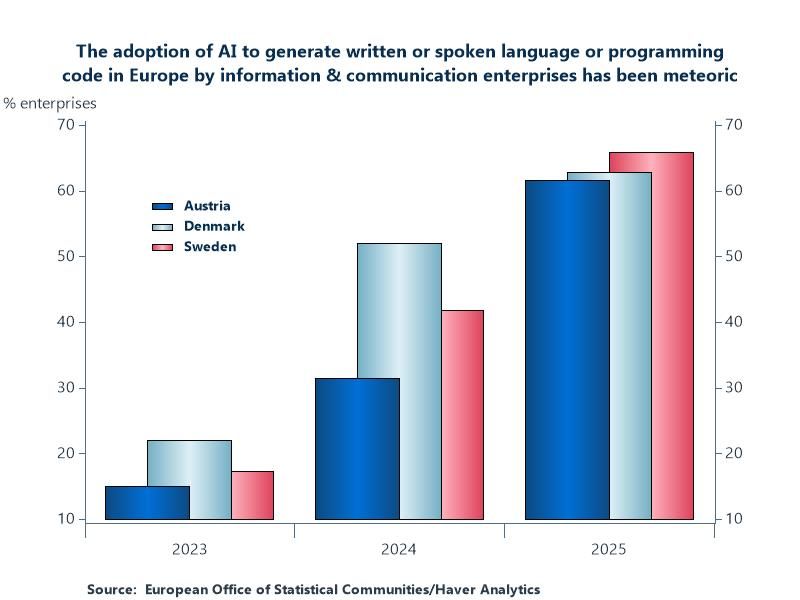
Chart: The adoption of AI to generate written or spoken language or programming codes in Europe by information & communication enterprises has been meteoric. In Austria, Denmark and Sweden – some of the top adopters – use has risen by 46, 41 and 49 percentage points, respectively, since 2023. Approximately one third of European countries covered are above 50% usage in 2025. The euro area’s information & communication enterprises as a whole are showing 43% adoption in 2025.
INTWKLY → World and Regional Indicators → Risk-On Risk-Off Index (RORO)
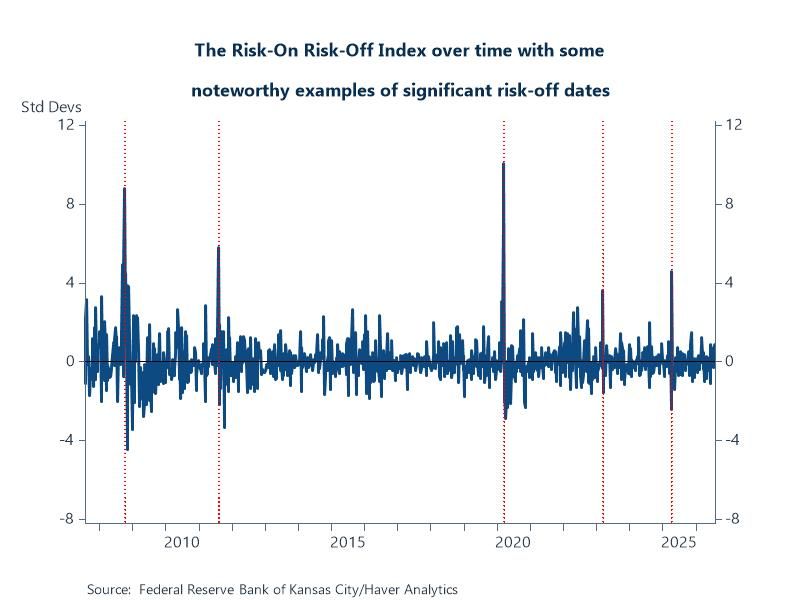
The RORO index was added to INTDAILY and INTWKLY. This index is a multifaceted measure designed to capture the realized variation in global investor risk appetite. It uses daily data from asset markets in the US and the euro area. It presents an aggregation of risk-on risk-off states of the world based on four broad categories reflecting variation in advanced economy credit risk, equity market volatility, funding conditions and currencies and gold. Data are sourced from FRB KC and start in May 2003.
Chart: The period of the Global Financial Crisis (fall 2008) and the early days of the COVID pandemic (3/2020) display some of the biggest risk-off movements, peaking above 10 standard deviations. The S&P downgrade of the US credit rating (8/2011), the collapse of Credit Suisse (3/2023), and liberation day (4/2025) also illustrate noteworthy examples of significant risk-off dates, reaching 5.8, 3.6 and 4.6 standard deviations, respectively.
EMERGELA → Colombia → Prices → Inflation Expectations by Items
Inflation expectation detail for Colombia was added to EMERGELA. Concepts include means, medians and standard deviations for current inflation, end of year, over 12 months, end of next year and over 24 months. Series are available for total CPI, CPI ex food, CPI ex food and regulated items, CPI for food and CPI for regulated items. Monthly data are sourced from Banco de la Republica de Colombia and start as early as 2003.
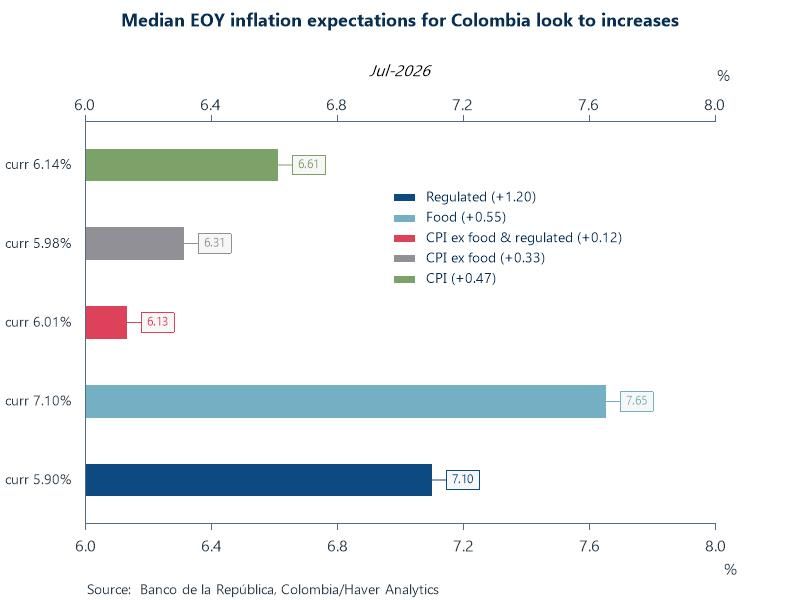
Chart: Looking ahead, Banco de la Republica expects inflation to continue increasing over the remainder of the year, reaching 6.61% for total CPI from its current level of 6.14%. Drivers include the lingering effects of the minimum wage increase, strong domestic demand, the imminent arrival of the El Niño phenomenon (affecting food supplies), and the risk of the conflict in the Middle East resuming (affecting regulated energy prices).
More Featured Data Additions
 Global| Sep 23 2026
Featured Data Additions, September 23, 2026
 Global| Sep 18 2026
Featured Data Additions, September 18, 2026
 Global| Sep 02 2026
Featured Data Additions, September 2, 2026
 Global| Aug 27 2026