

 Global| Aug 05 2026
Featured Data Additions, August 5, 2026
TOURISM → Countries and Special Areas Listed Alphabetically → Maldives → Tourist Arrivals
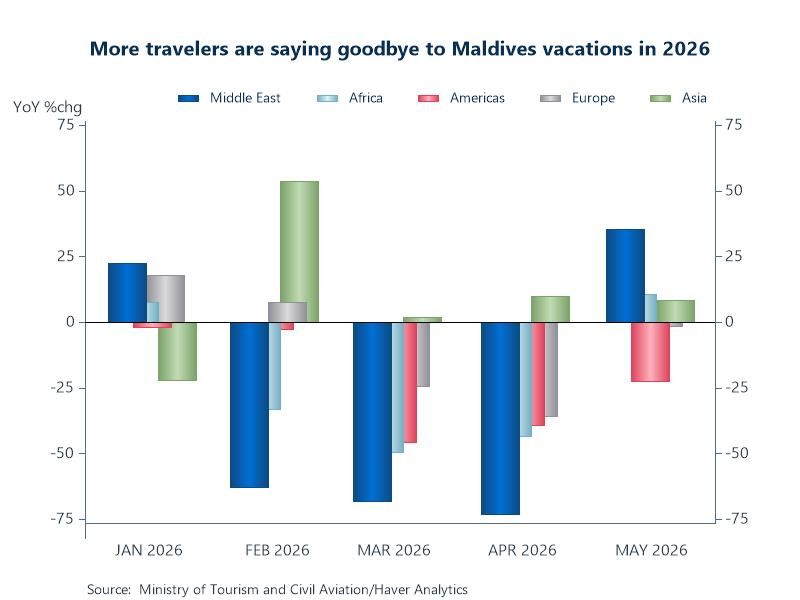
Tourist arrival detail for the Maldives was added to the TOURISM database. Tourist arrivals from 80 individual countries and 15 world regions are available on this table. Monthly data are sourced from the Ministry of Tourism and Civil Aviation and start as early as January 1988.
Chart: The Maldives has spent years cementing its reputation as one of the world's premiere luxury tropical destinations and has seen increasing tourist arrivals since the end of the pandemic. However, 2026 tells a different story with significant double-digit YoY decreases from most world regions. Ongoing instability in the Middle East has continued to ripple across global flight networks – and because many travelers reach the Maldives through Middle Eastern hubs, disruptions, rerouted flights, and higher fuel costs make the journey more complicated, expensive and thus less appealing.
EMERGECW → Lithuania → Financial → Debt (Domestic and Foreign) → Net External Debt
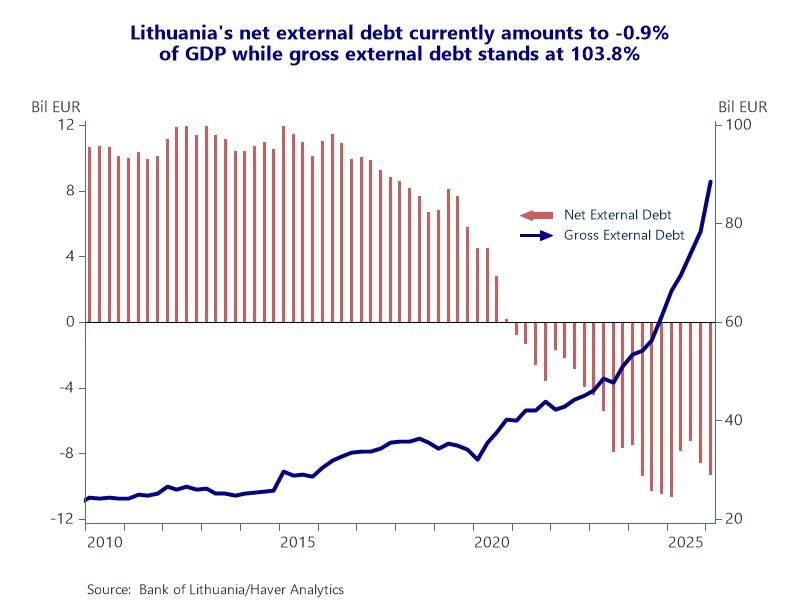
Net external debt statistics for Lithuania were added to the EMERGECW database. Seventy-four series are included on this table which displays the same level of detail as the existing gross external debt table. Quarterly data are sourced from the Bank of Lithuania and start in Q1 2004.
Chart: Despite a gross external debt of €88.6 billion, Lithuanian-owned assets abroad outpace foreign liabilities. Net external debt is negative, standing at -€9.3 billion or -10.9% of GDP as of Q1 2026. It peaked at 40% of GDP in Q2 2010 before steadily improving into negative territory thanks to sustained current account surpluses and capital inflows. A record low of -13.2% of GDP was achieved in Q1 2025. Ratings agencies like Fitch highlight this elimination of net external debt as a core pillar of Lithuania’s economic strength and recently upgraded its sovereigns to an A+ rating with a stable outlook.
ENERGY → OECD Net Effective Energy Rates
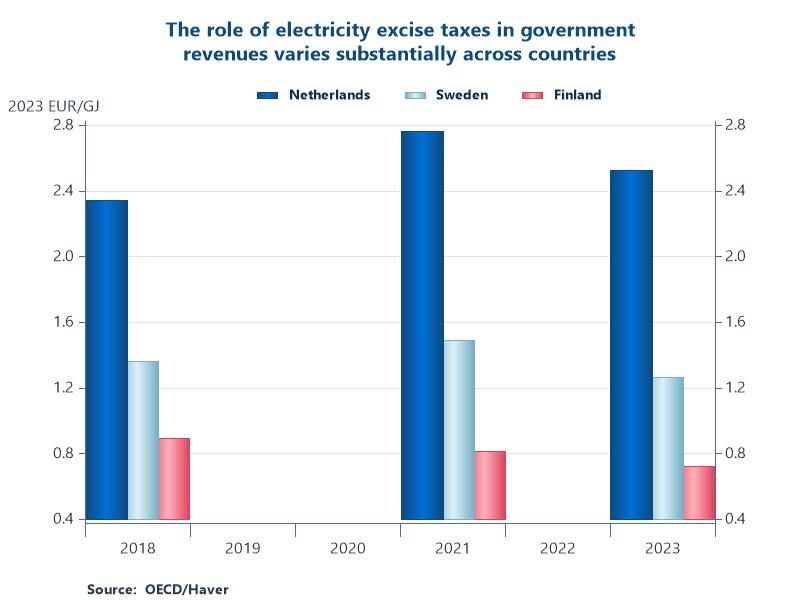
Effective energy rate (EER) statistics were added to ENERGY. The EER is the sum of fuel excise taxes, carbon taxes, electricity excise taxes and tradeable permits that effectively put a price on energy use. The net EER equals the EER minus fossil fuel and electricity subsidies that decrease pre-tax energy prices. This data set includes the EER and its components and is available for 79 individual countries. Annual data (not reported consecutively) are sourced from the OECD and start in 2018.
Chart: Of the 79 countries covered, 32 do not apply taxes on electricity use. Among those that levy an electricity excise tax, its role in revenues is still small relative to other tax instruments. However, in a few countries, such as the Netherlands, Sweden and Finland, revenues from electricity taxes make a more substantial contribution to government revenues. This is caused by a high electricity tax rate, a broad tax base due to a high degree of electrification, or a combination of both.
More Featured Data Additions
 Global| Sep 18 2026
Featured Data Additions, September 18, 2026
 Global| Sep 02 2026
Featured Data Additions, September 2, 2026
 Global| Aug 27 2026
Featured Data Additions, August 27, 2026
 Global| Aug 19 2026