

 Global| Jul 16 2026
Featured Data Additions, July 16, 2026
EMERGEFM → Liberia → International Trade and BOP → Trade by Country
International trade statistics by country for Liberia were added to EMERGEFM. Imports and exports to and from Africa, Asia & the Middle East, Europe & Oceania, and the Americas & the Caribbean including 39 individual countries are available. Annual data reported in USD are sourced from the Central Bank of Liberia and start in 2010.
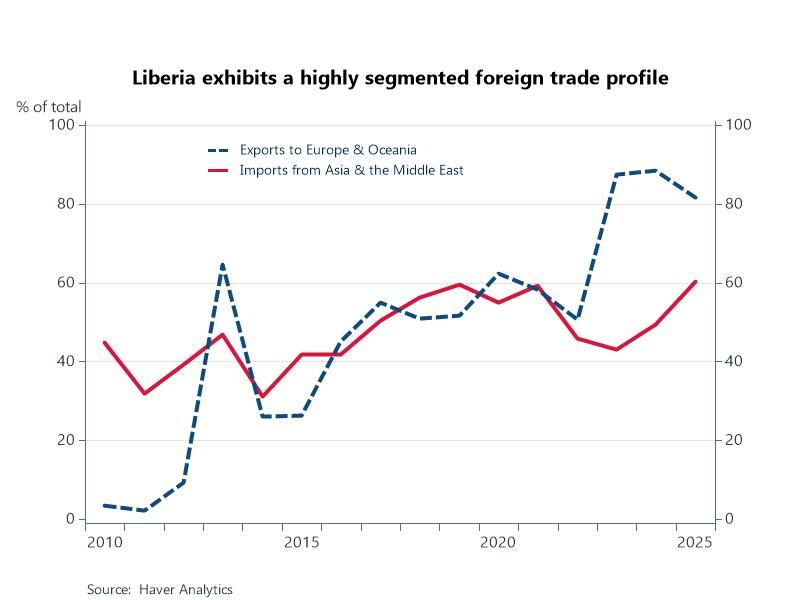
Chart: Liberia exhibits a highly segmented foreign trade profile where Europe dominates export destinations, while Asia serves as the primary source for the country's imports. Europe is the destination for 82% of exports, of which 73% goes to Switzerland in the form of unwrought gold. 60% of Liberia's imports - led by machinery, petroleum, and manufactured goods - originate from Asia & the Middle East with China, India, and Turkey as the leading suppliers, accounting for 84% of imports from that region.
CMDTY → Spot Prices → Brazil Agricultural Prices → Tilapia Prices
Tilapia prices for Brazil were added to the CMDTY database. Pricing series reported in USD per kilograms are available for five tilapia-producing regions. Prices represent amounts paid to fish farmers. Weekly data are sourced from the Center for Advanced Studies on Applied Economics and start in August 2021.
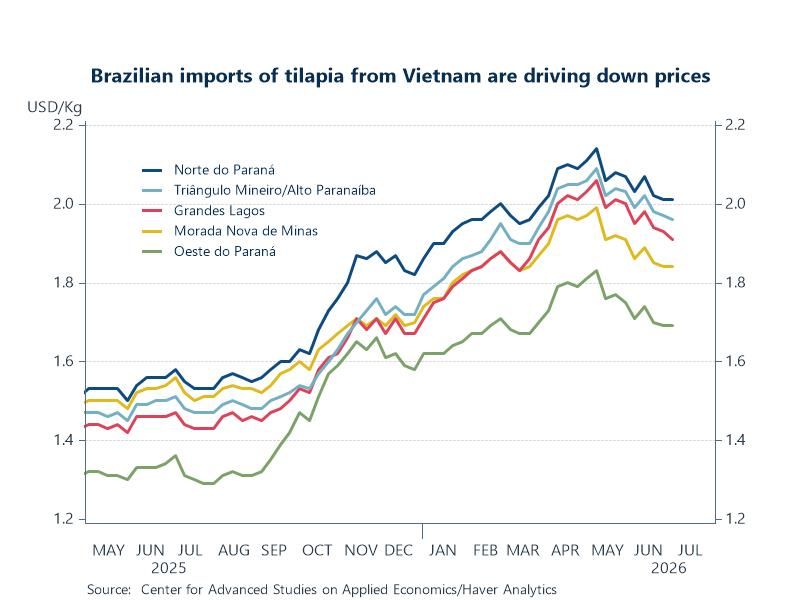
Chart: Brazil is the 4th largest tilapia producer in the world, trailing China, Indonesia and Egypt - driving an aquaculture sector that generates over $2.5 bil in annual revenue and supports an estimated 3 million direct and indirect jobs. Shortages of juvenile fish and adverse weather conditions caused tilapia prices to hit record highs in May 2026. Since then, a sudden surge of tilapia imports from Vietnam resulting from a trade agreement is driving down prices, raising alarms for local producers.
ENERGY → Short Term Energy Outlook (STEO) → Global Energy Security
Global energy security statistics were added to ENERGY. Tables include strategic oil inventories by country and energy product flows by chokepoint. The chokepoint table includes series for crude oil, petroleum products, and LNG for major chokepoints such as the Straits of Hormuz and Malacca, and the Suez and Panama canals. Quarterly data are sourced from the Energy Information Administration and start as early as Q1 2025.
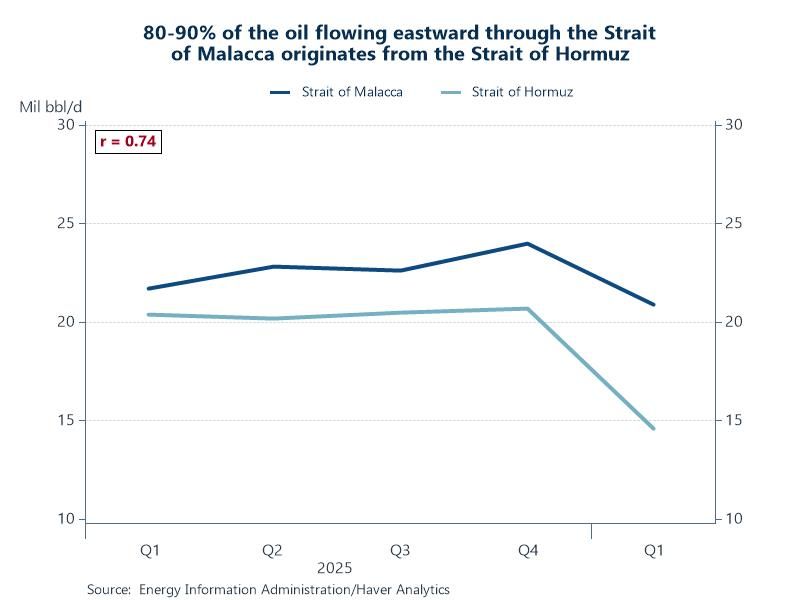
Chart: The Straits of Hormuz and Malacca are major interdependent global maritime chokepoints connected by the energy supply chain. 80-90% of the oil flowing eastward through the Strait of Malacca originates from the Strait of Hormuz, so a crisis in one strait directly impacts the other. In Q1 2026 (early into the Mideast conflict), Hormuz handled 14.6 mb/d of oil, down 29.5% QoQ. Malacca handled 20.9 mb/d in Q1, down 12.9% - affecting energy-hungry economies like China, Japan and South Korea.
More Featured Data Additions
 Global| Sep 18 2026
Featured Data Additions, September 18, 2026
 Global| Sep 02 2026
Featured Data Additions, September 2, 2026
 Global| Aug 27 2026
Featured Data Additions, August 27, 2026
 Global| Aug 19 2026