Haver Analytics
Haver Analytics

Featured Data Additions: 2025

  • SURVEYS → Federal Reserve Surveys and Indicators → Recent College Graduates Labor Market

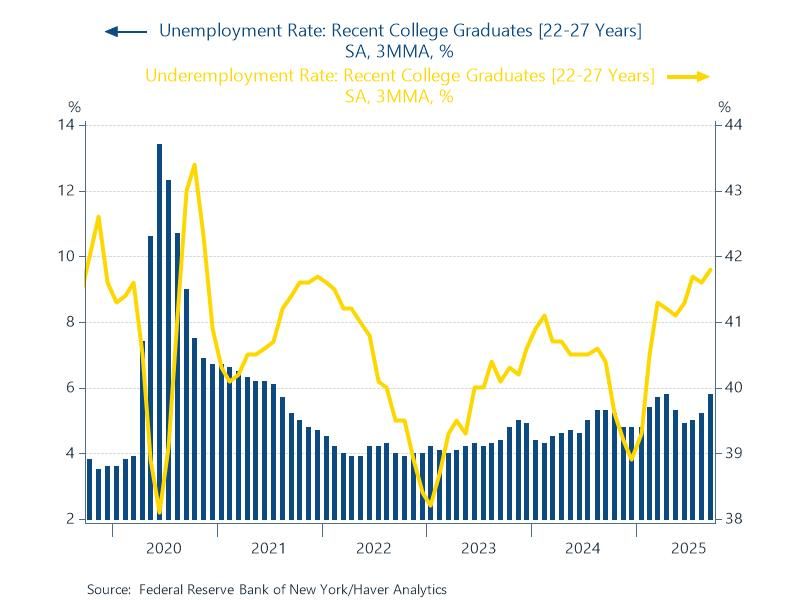
    Labor market statistics for recent college graduates in the US were added to the SURVEYS database. This data set includes unemployment rates, underemployment rates, and annual wage data for recent college graduates and other selected demographics useful for comparison. These monthly and annual data are sourced from the Federal Reserve Bank of New York and start in 1990.

    Chart: Labor market conditions remained challenging for recent college graduates during the third quarter of 2025. The unemployment rate increased to 5.8% in September and remained elevated for the quarter at an average of 5.3%. The underemployment rate rose to 41.8% - its highest level since 2020. Underemployment is defined as the share of college graduates working in jobs that typically do not require a college degree.

  • TRANSPRT → Cargo and Freight Statistics → Jamaica

    Cargo statistics for Jamaica’s ports were added to the TRANSPRT database. Detail includes series for transshipments and domestic cargo loaded and discharged at the Port of Kingston and outports, which refer to all major ports besides the primary Port of Kingston. These monthly data are sourced from The Port Authority of Jamaica and begin in January 2017.

    Chart: Port of Kingston transshipment cargo handling is on a strong positive trajectory. YTD y/y growth was 6.21% in July following almost two years of consecutive positive growth. This is being driven by major investments, new modern equipment like Super Post-Panamax cranes, expansion projects and achievement of international security standards - all positioning Jamaica as a key Caribbean logistics hub.

  • CRYPTO → Market Capitalization, Price & Volume → Stablecoins

    Market cap and turnover volume aggregates for stablecoins were added to the CRYPTO database. A stablecoin is a cryptocurrency designed to maintain a stable value relative to a certain asset. They are less volatile than other cryptocurrencies, making them a relatively reliable medium of exchange within the blockchain universe. These 7-day daily data are sourced from CoinGecko and start in 2015.

    Chart: Stablecoins are in the spotlight because of the GENIUS Act, which was signed into law in July and provides a regulatory framework for their adoption and issuance. Today, the stablecoin market has grown to $311 billion, accounting for 9.9% of the broader $3 trillion crypto ecosystem. The stablecoin market cap ended November at a 0.29% month over month decrease, but prior to that, it sustained 25 consecutive months of positive growth.

  • NORDICNorway → Employment, Earnings and Labor Cost → Flows between Labor Force Statuses

    Flows between labor force statuses for Norway were added to the NORDIC database. This dataset includes measures in and out of employed, unemployed and inactive. Series are available as flows reported in thousands or flows reported as percents of the labor force status. Quarterly data are sourced from Statistics Norway and start in Q2 2006.

    Chart: Historically, intersections between improving status flows and worsening status flows have aligned with recessionary periods in Norway. Since Q4 2020, improvements in labor force status flows have been greater than worsening labor force status flows. However, despite the flows never coming close to intersecting, Norway did experience a recessionary period in 2022 to 2023.

  • ENERGY → Petroleum → Petroleum Product Prices Including Pump Prices → South Africa

    Fuel prices for South Africa were added to ENERGY. Prices for petrol, diesel, kerosene and LPG are available for inland and coastal regions. These 7-day daily data are sourced from the Department of Mineral Resources and Energy (DMRE) and start in January 2013. The DMRE is the government body responsible for setting and announcing monthly adjustments to the regulated fuel prices which take effect every first Wednesday of the month.

    Chart: On the morning of Wednesday, Nov 5th, South Africa’s fuel prices were cut across the board. Inland prices for petroleum-based fuels saw a rather large cut of R0.51c/l, while diesel motorists saw a smaller cut of R0.21c/l. Kerosene and LPG prices were also slashed. Despite a sudden surge in oil prices in late October, a strong month for the rand compared to the US$ helped materialize the price cut.

  • GLSECTOR → Selected Indicators by Country/Special Areas → Indonesia → Agricultural Production

    Agricultural production statistics for Indonesia were added to the GLSECTOR database. This table reported in thousands of metric tons includes some of the major commodities like rubber, palm oil, and sugar cane. Monthly data are sourced from Badan Pusat Statistik and start in January 2009.

    Chart: While the rubber production sector is economically important and employs millions, it faces challenges like declining productivity per hectare, low prices, and stagnant demand over the last decade. On the other hand, palm oil is more profitable, leading farmers to convert rubber plantations to oil palm. The commodity benefits from high global demand, government support, and favorable cultivation conditions, driving its expansion.

  • EMERGEPRVietnam → National Accounts → Spending on Research & Development

    Spending on research and development statistics for Vietnam were added to EMERGEPR. Series reported in billions of dongs are available by funding sources, by field of study, and by area of activity. Annual data are sourced from the National Statistics Office of Vietnam and start in 2015.

    Chart: R&D spending in Vietnam has risen from 0.36% of GDP in 2015 to 0.43% in 2021, and stands at 0.42% as of 2023. Despite the slight upward trend, the scale and structure of R&D investment still lags behind regional and global peers. In contrast, China allocates 2.63% of GDP to R&D, enabling rapid technological advancement. The Vietnamese government has set a goal of increasing R&D investment to 2% of GDP by 2030 – without it, the country risks being trapped between low-cost manufacturing economies and high-tech powerhouses.

  • ENERGY → Electricity → Area Price by Region → Japan Electric Power Exchange

    Electricity trading statistics for Japan were added to the ENERGY database. Wholesale spot electricity market prices for 9 Japanese regions are available, along with a table for contract buying and selling volumes. These 7-day daily data are sourced from the Japan Electric Power Exchange and start in April 2005.

    Chart: Differences in electricity prices between eastern and western Japan are caused by the separation of the country's grid into two separate systems with distinct operating frequencies. Western Japan has seen more efficient nuclear reactor restarts and a higher concentration of solar power, which contributes to lower prices. Prices in eastern Japan can have a risk premium associated with the continued delays of nuclear reactor restarts. The region also relies more heavily on expensive thermal generation.