 Global| Nov 05 2025
Featured Data Additions, November 5, 2025
ENERGY → Electricity → Area Price by Region → Japan Electric Power Exchange
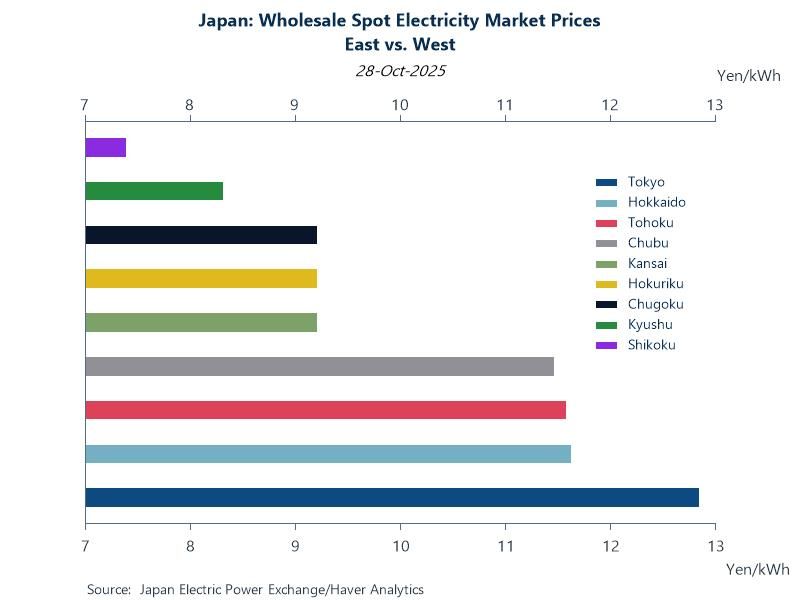
Electricity trading statistics for Japan were added to the ENERGY database. Wholesale spot electricity market prices for 9 Japanese regions are available, along with a table for contract buying and selling volumes. These 7-day daily data are sourced from the Japan Electric Power Exchange and start in April 2005.
Chart: Differences in electricity prices between eastern and western Japan are caused by the separation of the country's grid into two separate systems with distinct operating frequencies. Western Japan has seen more efficient nuclear reactor restarts and a higher concentration of solar power, which contributes to lower prices. Prices in eastern Japan can have a risk premium associated with the continued delays of nuclear reactor restarts. The region also relies more heavily on expensive thermal generation.
WTO → Bilateral Imports (MTN Product Groups)
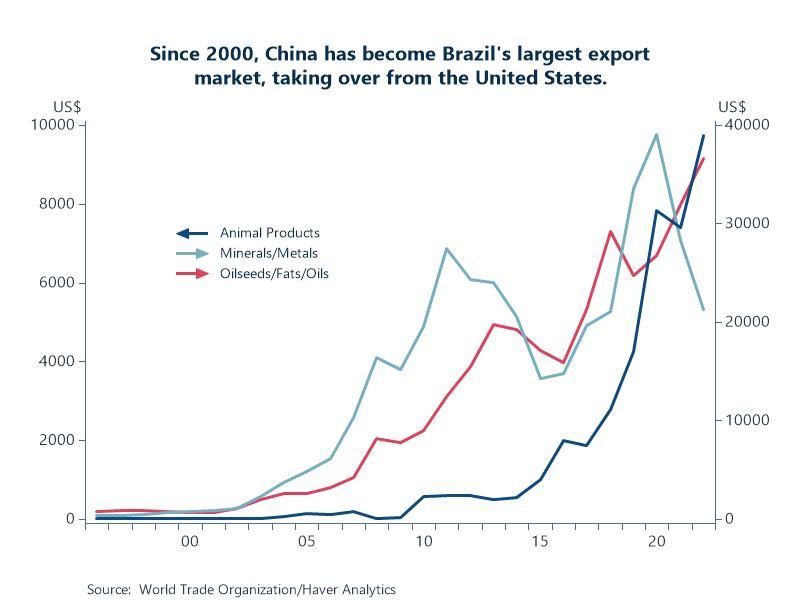
Over 200K bilateral import series were added to the WTO database. Data are available for 140 reporting countries and 190 partner countries for the 22 multilateral trade negotiations (MTN) product categories. This is the product classification system used by the WTO for their trade statistics and is based on the HS commodity groupings. These annual data are sourced from the World Trade Organization and begin in 1996.
Chart: The US was the largest trade partner for over 80% of emerging market economies in 2000, but China has surpassed the US for over 65% of these countries. Brazil is one example in Latin America. China's rising demand for food and raw materials, and Brazil's ability to supply them cheaply created the market. China's investment in Brazilian infrastructure, its WTO accession in 2001 and resulting trade liberalization also contributed by improving market access.
ENERGY → Petroleum → Petroleum Product Prices Including Pump Prices → Papua New Guinea
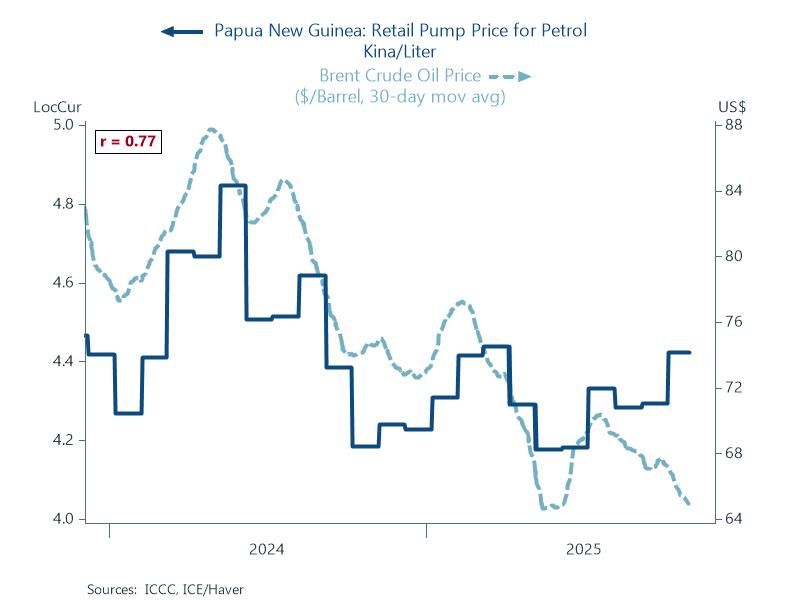
Retail pump prices for Papua New Guinea were added to the ENERGY/INTDAILY/INTWKLY databases. Series include prices for diesel, petrol and kerosene. Prices include taxes, duties & other charges. These 7-day daily data are sourced from the Independent Consumer and Competition Commission (ICCC) and begin in June 2023.
Chart: One of the functions of the ICCC is to set maximum retail fuel prices each month. It does this by using a formula that incorporates the import parity price (IPP), which is influenced by international crude oil prices, and adjusted for domestic freight costs and the kina exchange rate. As of October 2025, fuel prices in PNG are approximately K4.42 per liter for petrol, K4.24 for diesel and K3.92 for kerosene. Retailers can sell fuel for less than these prices, but not for more.
EMERGELA → Chile → International Trade and Balance of Payments → Volume or Value
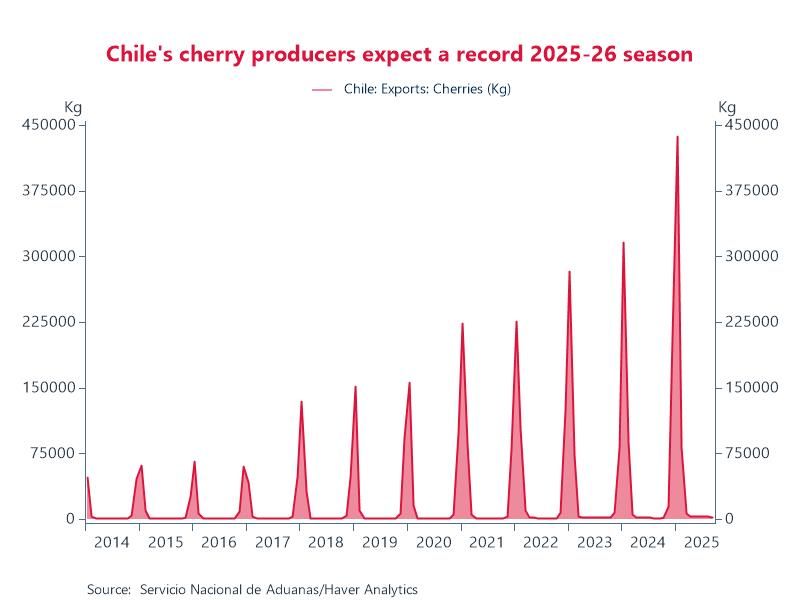
Exports reported in volumes (kg) and values (US$) for Chile have been added to the EMERGELA database. Each table includes a detailed breakdown for the mining and nonmining industries. These monthly series are sourced from Chile’s National Customs Service and start in January 2014.
Chart: In the southern hemisphere, Chile accounts for 96% of cherry exports, reinforcing its global leadership in this market. From that production, 9 out of 10 shipments are bound for China due to high demand during Chinese New Year, where cherries symbolize good luck and are a popular gift. Chile's peak cherry harvest season coincides with this holiday, creating a perfect supply/demand opportunity, and is further complemented by a free trade agreement which includes zero tariffs for cherries.
More Featured Data Additions
 Global| Jun 26 2026
Featured Data Additions, June 26, 2026
 Global| Jun 17 2026
Featured Data Additions, June 17, 2026
 Global| Jun 12 2026
Featured Data Additions, June 12, 2026
 Global| Jun 03 2026