 Global| Jan 28 2026
Featured Data Additions, January 28, 2026
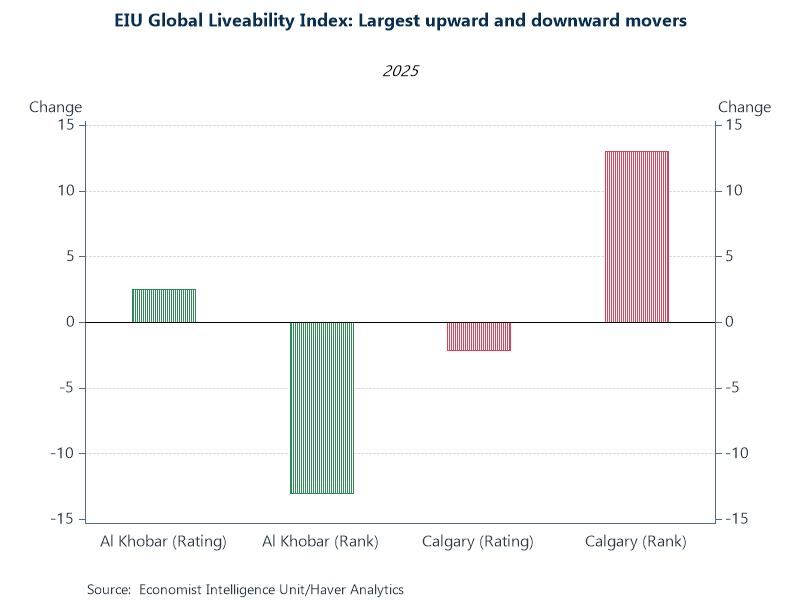
EIULIVE → EIU Global Liveability Index
A new database (EIULIVE) containing EIU’s Global Liveability Index was added to the Haver offering. These data assess which cities around the world offer the best and worst living conditions. 173 cities are assigned a score for over 30 qualitative and quantitative factors across 5 broad categories: stability, healthcare, culture & environment, education and infrastructure. The scores are then compiled and weighted to derive category ratings. An overall rank is also available. These annual data start in 2009.
Chart: Al Khobar saw the biggest improvement since last year with its overall rating increasing by 2.5 in 2025 improving its overall rank by 13 (#135 overall). Saudi Arabia is investing heavily in improving access to healthcare and education under their Vision 2030 program. Calgary was ranked #5 overall in 2024 and saw a 2.1 point decrease in its overall rating in 2025 causing its rank to plummet by 13 places which now sits at #18. Strains in the country’s national health service intensified lowering Calgary’s healthcare score.
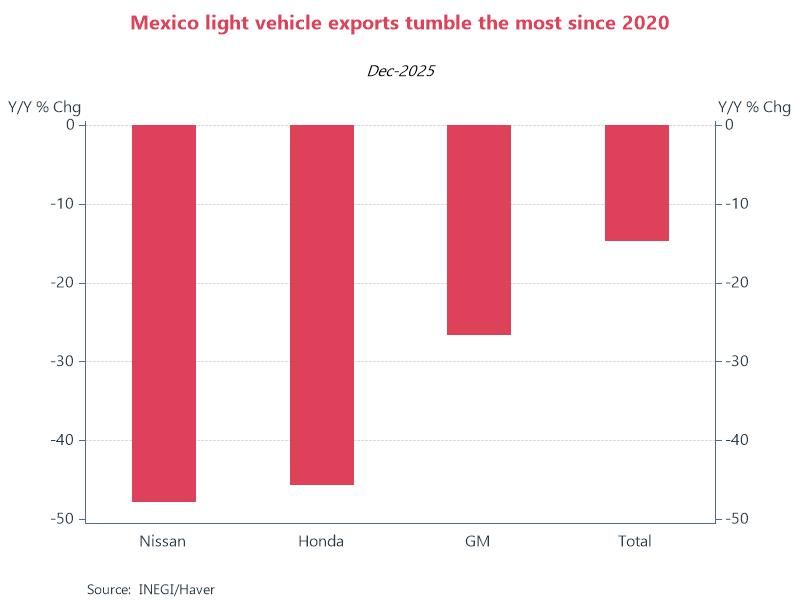
TRANSPRT → Vehicle Statistics → Mexico → Exports by Manufacturer by Country
Light vehicle exports by make and destination country for Mexico were added to the TRANSPRT database. Detail includes series for the 15 makes of light vehicles manufactured in Mexico and the roughly 90 destination countries. Monthly data are sourced from INEGI and start in January 2005.
Chart: Light vehicle exports from Mexico plunged by 14.6% YoY to 227,262 units in December 2025, marking the 8th monthly YoY decline of 2025 and making it the sharpest annual drop since 2020. The decrease reflected the impact of tariffs by the US government on Mexican autos and parts, which is a key manufacturing hub for global brands that sell to the US. YoY exports plunged in December for Nissan (-47.7%), Honda (-45.5%) and General Motors (-26.5%).
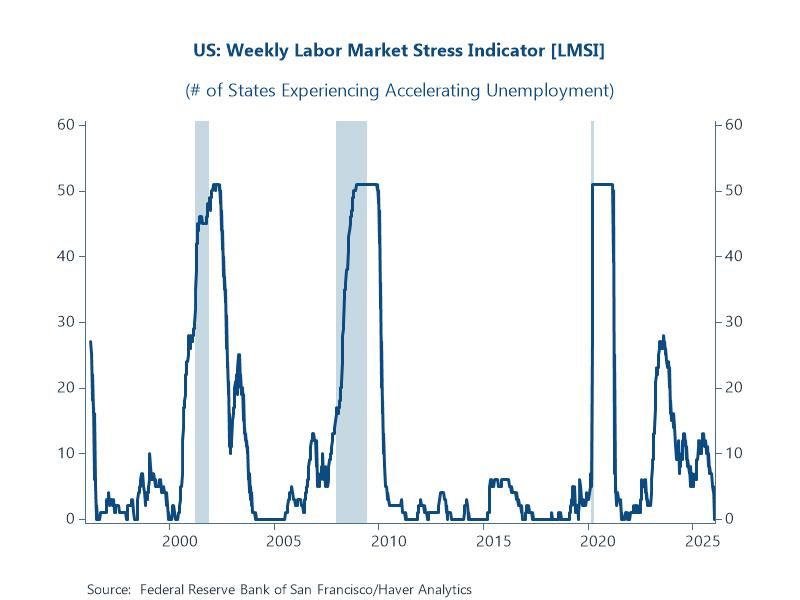
WEEKLY → Employment and Unemployment → Labor Market Stress Indicator (LMSI)
The Weekly Labor Market Stress Indicator (LMSI) was added to WEEKLY. The LMSI tracks state-level labor market developments to better understand in real time what these data can tell us about the economy. It is constructed using the ratio of initial and continued weekly unemployment claims over a state’s approximate labor force. There is a series for the number of states experiencing accelerating unemployment and a series for the share of the labor force in those states. Weekly data are sourced from FRB of San Francisco and start in 1996.
Chart: According to the LMSI, the number of states experiencing accelerating unemployment has been decreasing since mid-July and is currently stands at 0 in the latest week – indicating a stable labor market. Of course, history teaches us that labor market conditions can change quickly. These data serve as a tool to help monitor those changes as they evolve. Also note how these series closely track NBER recessions.
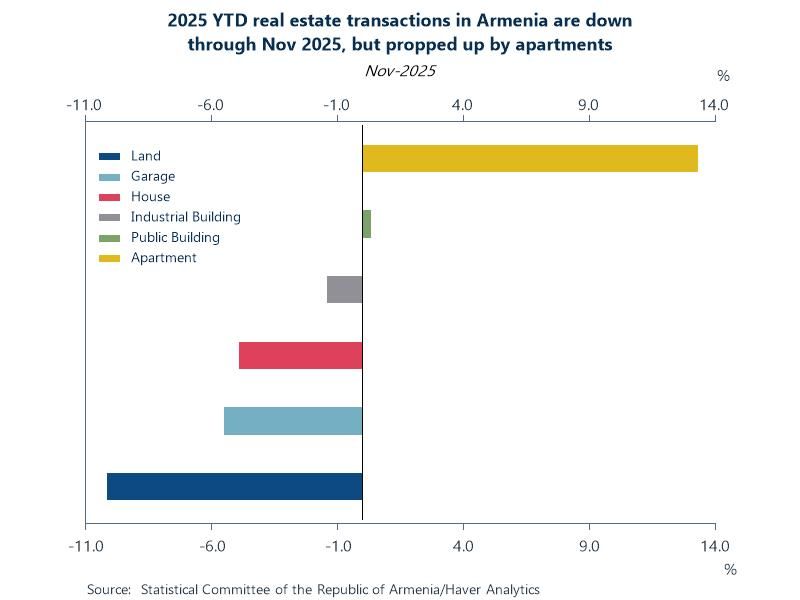
EMERGECW → Armenia → Housing → Real Estate Transactions
Number of real estate transactions by property type statistics for Armenia were added to the EMERGECW database. Detail includes series for apartments, homes, industrial & public buildings, garages and land with a sub-series for agricultural land. These monthly data are sourced from the Statistical Committee of the Republic of Armenia and start in January 2018.
Chart: After a strong 2024 that ended with a 12.9% YoY increase in number of real estate transactions in Armenia, 2025 started in negative territory of around 7.0%. Despite YTD real estate transactions being down for almost all categories through November 2025, the total is down only 2.5% due to a strong performance by real estate transactions for apartments, which are up 13.3% through November.
More Featured Data Additions
 Global| Jun 26 2026
Featured Data Additions, June 26, 2026
 Global| Jun 17 2026
Featured Data Additions, June 17, 2026
 Global| Jun 12 2026
Featured Data Additions, June 12, 2026
 Global| Jun 03 2026