 Global| Jan 23 2026
Featured Data Additions, January 23, 2026
ANZR/ANZ → Public Finance → Early Childhood Education: Child Care Subsidy (CCS)
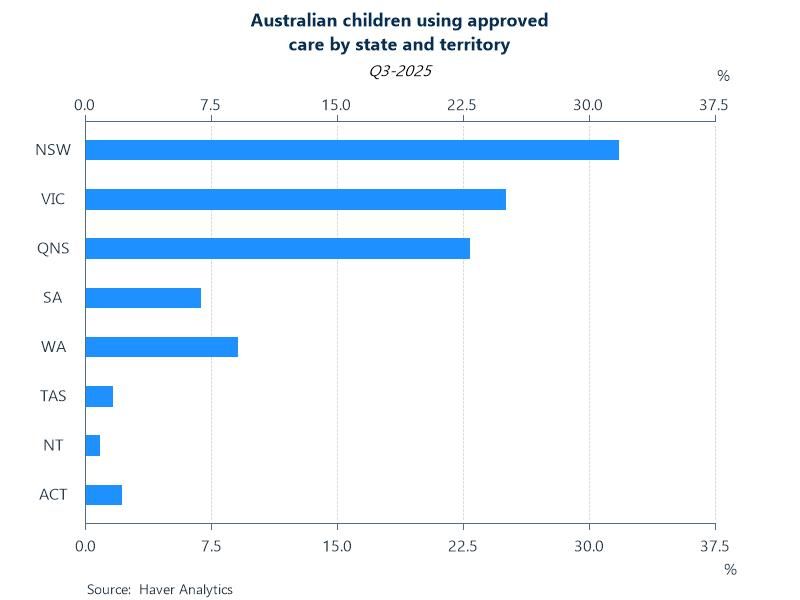
Child care subsidy (CCS) statistics for Australia were added to the ANZ and ANZR databases. Series include number of children using approved child care, number of families, number of approved services, and the estimated CCS in Australian dollars. These data are available by state and territory. Quarterly data are sourced from the Department of Education and start in Q4 2012.
Chart: 1,451,860 children from 1,020,930 families were allocated a Customer Reference Number (CRN) by Services Australia in Q3 2025, down 0.13% from Q3 2024. New South Wales had the largest share of children attending approved care, at 31.7% or 460,610 children. Victoria had the largest proportional YoY increase, at 1.03% or 3,700 children.
PMICPS → Global Price Pressure Index or Global Supply Shortage Index
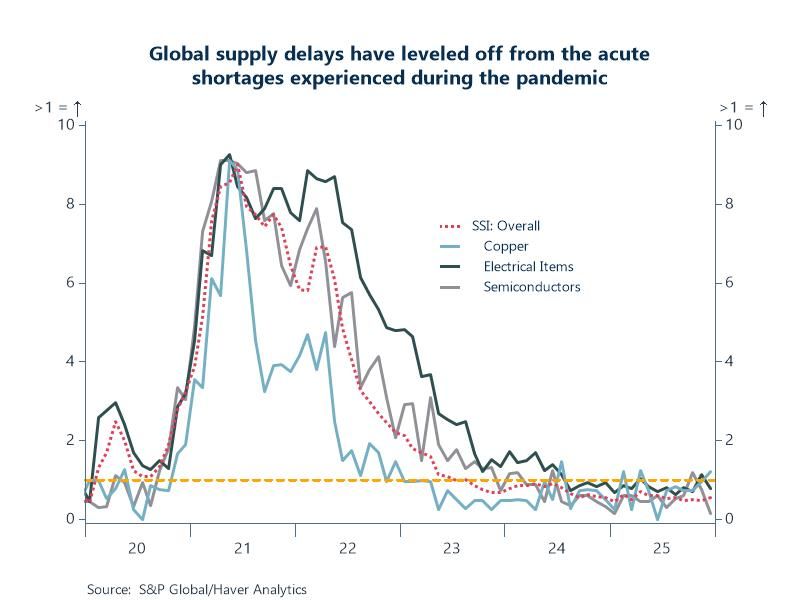
A new database (PMICPS) containing global price pressure and supply shortage indexes was added to the Haver offering. These indexes are derived from PMI business surveys collected from approximately 10K manufacturing companies worldwide. Detail is available for 20+ commodity groupings, allowing for an additional level of detail compared to the PMI business surveys. These monthly data are sourced from S&P Global and start in January 2005.
Chart: SSI values >1.0 indicate above average supply shortages - the higher the value, the greater the degree of shortages relative to the long-run trend. The overall index currently stands at 0.5523 and has not shown above average global supply shortages since mid-2023. The copper SSI has been increasing for 6 consecutive months and currently stands at 1.2109, which points to above average incidences of shortages. Electrical items were showing above average shortages last month, but have eased and currently stand at 0.7707 – which is below 1 but higher than the overall index. Semiconductors, showing above average shortages 2 months ago, have also dipped below 1 and below the overall index.
PMIMET → Global Aluminum/Copper/Steel PMIs
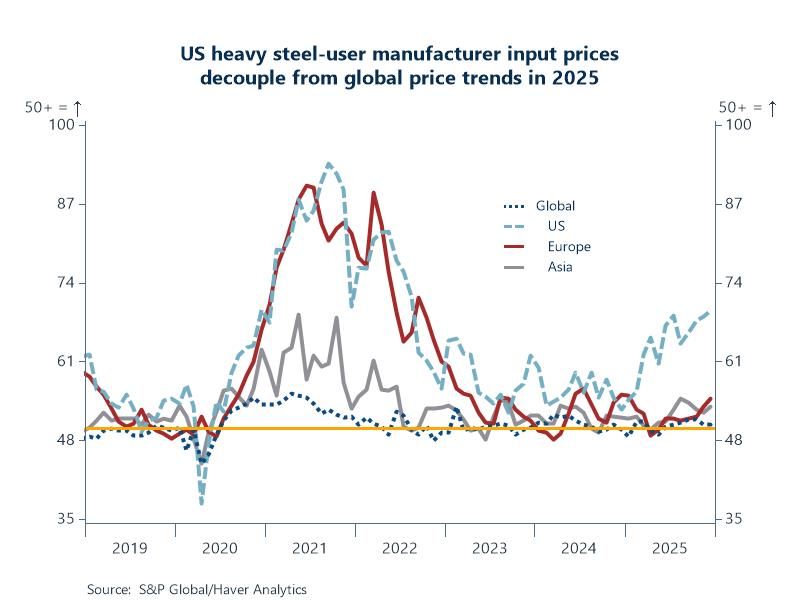
A new database (PMIMET) containing global metal-user PMI statistics was added to the Haver offering. These indicators attempt to give an accurate overview of operating conditions at manufacturers identified as heavy users of aluminum, copper and steel. Samples are selected from S&P Global's worldwide PMI survey panels, polling over 27k companies in over 40+ countries. Monthly data start in 1997 for Europe, 2004 for Asia, and 2007 for the US.
Chart: Average operating expenses increased modestly at global steel users in December, with the rate of reported inflation the weakest since July. The US, however, is experiencing significantly more input price increases in 2025 with the latest reading coming in at 69.3548 – the highest since August 2022. US input price increases for steel users have essentially decoupled from world trends. Both Europe and Asia reported input price increases as well, but at much lower rates.
EIUDEM → EIU Democracy Index
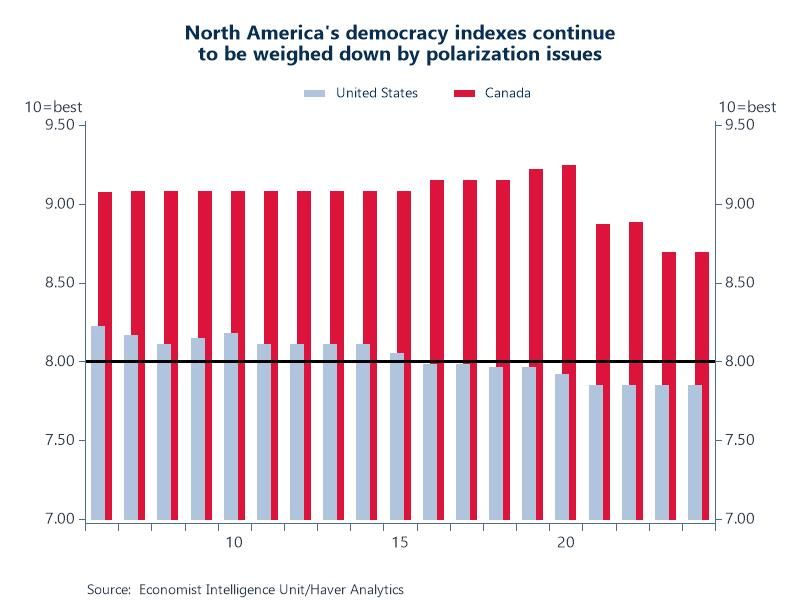
A new database (EIUDEM) containing the EIU’s Democracy Index data set was added to the Haver offering. The data provide a snapshot of the state of democracy in 165 independent states and two territories. This covers almost the entire global population. Scored on a 0-10 scale, the democracy index is based on five categories. Annual data start in 2006.
Chart: Globally, North America remains a top performer. The region’s overall score stands at 8.27 in 2024, unchanged from 2023, putting it just behind western Europe. Canada retained its overall score of 8.69 in 2024, and its global ranking of 14 was basically unchanged. The US continues to trail Canada, with a score of 7.85 in 2024, unchanged from 2023 and places it 28 in the global ranking. Political culture is the lowest scoring category and has been weighing down North America’s performance in recent years – enough to downgrade the US to a flawed democracy status in 2016 when its democracy index score dipped below an 8.
More Featured Data Additions
 Global| Jun 26 2026
Featured Data Additions, June 26, 2026
 Global| Jun 17 2026
Featured Data Additions, June 17, 2026
 Global| Jun 12 2026
Featured Data Additions, June 12, 2026
 Global| Jun 03 2026