 Global| Dec 17 2025
Featured Data Additions, December 17, 2025
TRANSPRT → Cargo and Freight Statistics → Jamaica
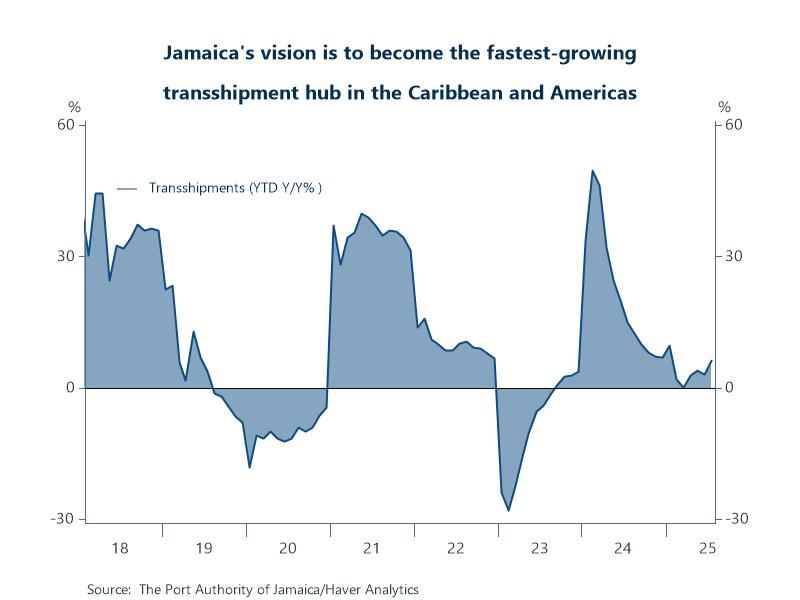
Cargo statistics for Jamaica’s ports were added to the TRANSPRT database. Detail includes series for transshipments and domestic cargo loaded and discharged at the Port of Kingston and outports, which refer to all major ports besides the primary Port of Kingston. These monthly data are sourced from The Port Authority of Jamaica and begin in January 2017.
Chart: Port of Kingston transshipment cargo handling is on a strong positive trajectory. YTD y/y growth was 6.21% in July following almost two years of consecutive positive growth. This is being driven by major investments, new modern equipment like Super Post-Panamax cranes, expansion projects and achievement of international security standards - all positioning Jamaica as a key Caribbean logistics hub.
GLSECTOR → Military Expenditure by Region and Country
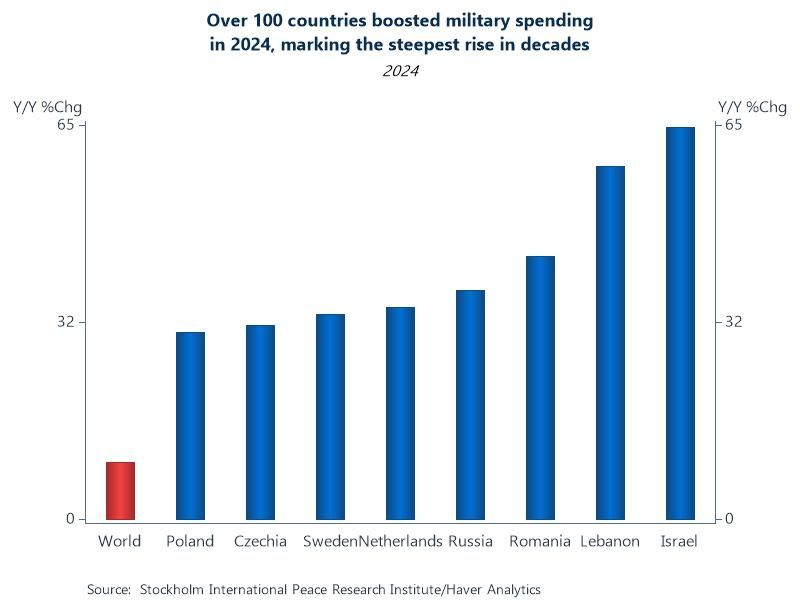
Global military expenditure statistics were added to the GLSECTOR database. This data set contains data for almost 200 countries and world regions. Expenditures are presented in real and nominal USD, as a percent of GDP & government spending and per capita. These annual data are sourced from the Stockholm International Peace Research Institute and start as early as 1949.
Chart: Global military expenditure hit $2.7 trillion in 2024, a 9.4% y/y increase, the largest since the end of the Cold War. This puts military spending at a record high, driven by conflicts in Ukraine and the Middle East. Over 100 countries boosted spending in 2024 impacting budgets as a share of GDP and government spending. In essence, the world is witnessing an unprecedented widespread militarization driven by conflict and strategic competition, shifting resources from peacebuilding to national defense.
USECON → International Trade and Balance of Payments → State of US Tariffs
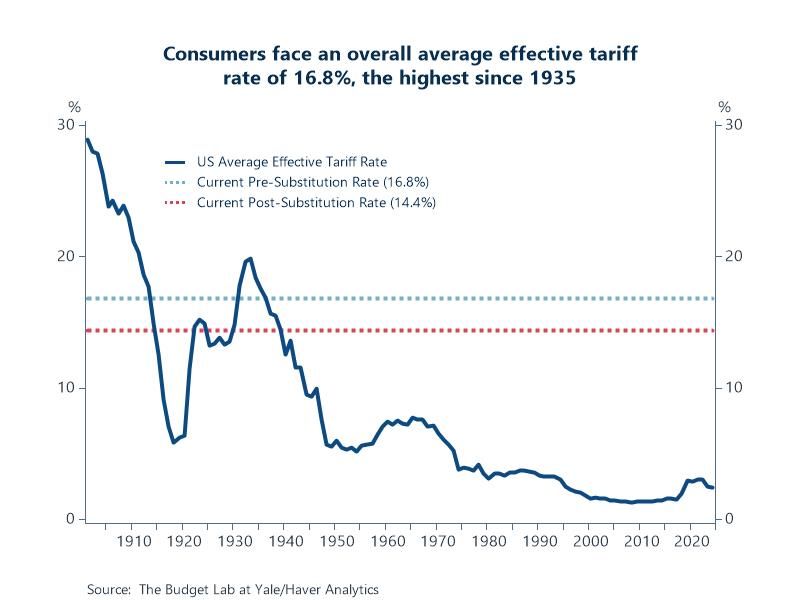
Statistics on the economic effects of the 2025 US tariffs and foreign retaliation were added to USECON. This data set estimates tariff revenue and its effects on real GDP, price levels, disposable income, and the effective tariff rate. Forecasts out to 2035 are available for some concepts. These monthly, quarterly and annual data are sourced from The Budget Lab at Yale.
Chart: Assuming there are no shifts in the import shares of different countries and products—current tariff policy would increase the average effective tariff rate to 16.8%, the highest since 1935. A pre-substitution approach is a good measure of welfare, since it reflects the full cost faced by consumers before they start making difficult spending choices. After imports shift in response to the tariffs, the overall US effective tariff rate is estimated to decrease to 14.4%, the highest since 1939. The timing of the transition from pre to post substitution is uncertain. Some shifts are likely to happen quickly, while others may take longer.
EMERGEMA → Israel → Business Cycle Indicators & Surveys → Monthly Index of Economic Activity
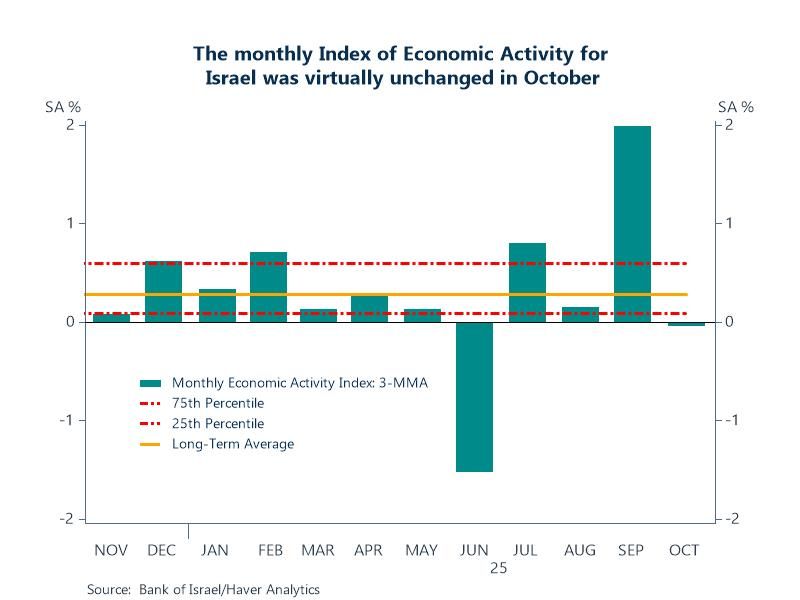
The Monthly Index of Economic Activity for Israel was added to EMERGEMA. This data set replaces the Composite State of the Economy Index, which recently ceased publication. Series include the main index along with contributions by the 11 main categories. In addition, monthly growth rates for the 34 underlying variables are available. Monthly data are sourced from the Bank of Israel and begin as early as 2000.
Chart: The monthly Index of Economic Activity was virtually unchanged in October, following an increase in September that reflected the emergence from Israel’s military operation against Iran. The Index was negatively influenced by much of the underlying data including declines in credit card purchases and goods exports in the mixed-high technology industries – however indirect tax and income tax data, and actual GDP for the third quarter moderated the decline in the Index.
More Featured Data Additions
 Global| Jun 26 2026
Featured Data Additions, June 26, 2026
 Global| Jun 17 2026
Featured Data Additions, June 17, 2026
 Global| Jun 12 2026
Featured Data Additions, June 12, 2026
 Global| Jun 03 2026