 Global| Nov 12 2025
Featured Data Additions, November 12, 2025
EMERGEPR → Vietnam → National Accounts → Spending on Research & Development
Spending on research and development statistics for Vietnam were added to EMERGEPR. Series reported in billions of dongs are available by funding sources, by field of study, and by area of activity. Annual data are sourced from the National Statistics Office of Vietnam and start in 2015.
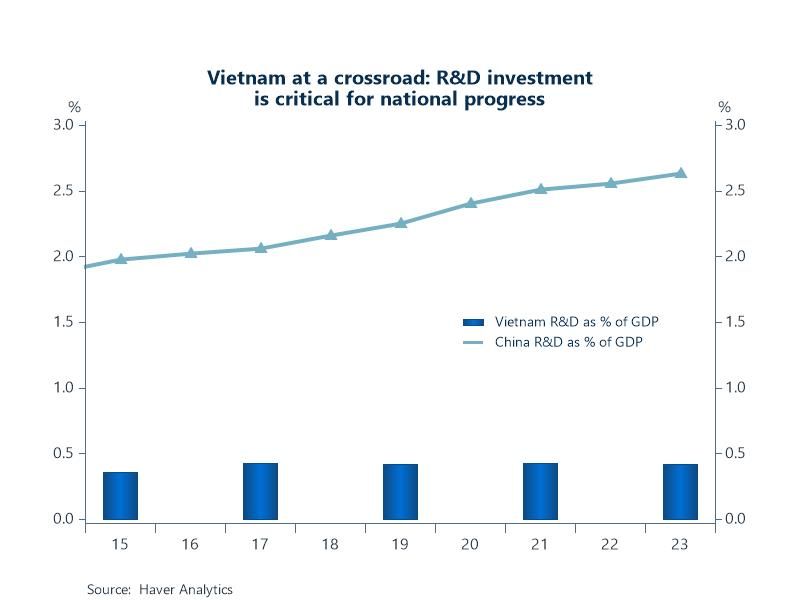
Chart: R&D spending in Vietnam has risen from 0.36% of GDP in 2015 to 0.43% in 2021, and stands at 0.42% as of 2023. Despite the slight upward trend, the scale and structure of R&D investment still lags behind regional and global peers. In contrast, China allocates 2.63% of GDP to R&D, enabling rapid technological advancement. The Vietnamese government has set a goal of increasing R&D investment to 2% of GDP by 2030 – without it, the country risks being trapped between low-cost manufacturing economies and high-tech powerhouses.

EMERGEPR → Philippines → Demographics → Population Projections
Population projections for the Philippines were added to the EMERGEPR database. Detail includes series by 5-year age groups and by sex. These annual data are sourced from the Philippine Statistics Authority and start in 2020 with projections out to 2055.
Chart: With a fertility rate of around 1.9 births per woman in the Philippines, the country is now below the replacement level of 2.1 needed to sustain population growth, which dropped to a 0.8% average between 2021 and 2023, compared to a 1.6% average the 3 years prior. Projections show the population aged 65 and older will comprise over 7% of the total by 2030, the threshold that classifies a country as aging. However, unlike some of its already aging East Asian peers, the Philippines lags in health, education, and social infrastructure to help cushion the blow.

SURVEYS → Federal Reserve Surveys and Indicators → Twelfth District Business Sentiment Indexes
The 12th District Business Sentiment data set was added to SURVEYS. This data set presents two qualitative indexes that track the views of business leaders across the western United States—the Business Sentiment Index and the Inflation Gauge Index. The detail indicates whether they see national output growth and inflation rates increasing, decreasing, or staying stable over the coming year. These monthly data are sourced from the San Francisco Fed and start in March 2014.
Chart: In the October survey, 56% of business leaders across the western US expect a weaker than average national economy over the next year. An additional 12% expect a recession. 32% expect average growth. No respondents expect stronger than average growth or better. These figures are an improvement from the previous month where 59% expected weaker than average growth and 20% expected a recession.

EMERGECW → Hungary → Prices → MNB Evolution of Perceived and Expected Inflation
Series for the evolution of perceived and expected household inflation for Hungary were added to the EMERGECW database. These monthly data are sourced from Magyar Nemzeti Bank (aka the Central Bank of Hungary) and start in January 2015.
Chart: From 2015-2019, CPI fluctuated in a range of 0-3%, while inflation expectations were 9.5% on average. Rather than following actual inflation, perceptions closely followed expectations. The strong correlation between perceptions and expectations lasted until 2020 when actual inflation started to increase and gaps started to appear between the two indicators. Starting in August 2022, perceptions became significantly higher than expectations, but since mid-2024, the gap between the two appears to have stabilized.

More Featured Data Additions
 Global| Feb 04 2026
Featured Data Additions, February 4, 2026
 Global| Jan 28 2026
Featured Data Additions, January 28, 2026
 Global| Jan 23 2026
Featured Data Additions, January 23, 2026
 Global| Jan 14 2026


