 Global| May 20 2026
Featured Data Additions, May 20, 2026
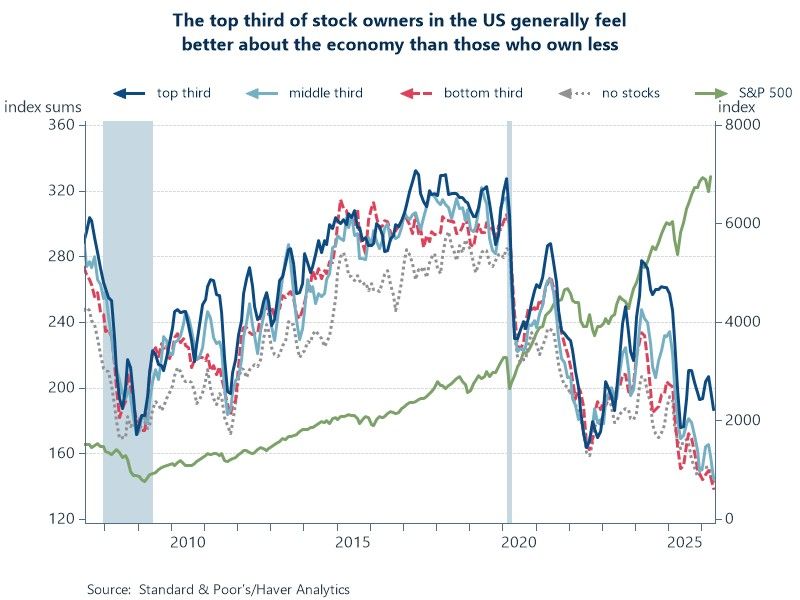
UMSCA → Summary Consumer Sentiment Indexes → The Index of Consumer Sentiment by Tercile of Stock Wealth
Indexes categorized by stock ownership were added to the UMSCA database, where the University of Michigan Survey of Consumers detail is housed. Indexes include consumer sentiment, current economic conditions, and consumer expectations. For each, series are available for the top third, middle third, and bottom third terciles of stock ownership, and also series for no stock holdings. Monthly data start in November 1998.
Chart: Plotted are the sums of each ownership category for the three indexes along with the S&P 500. The optimism spread between the largest stock owners and people with lesser portfolios is currently at one of its widest points dating back to 1998. In fact, optimism for the bottom three ownership categories are currently at all-time lows. Not so coincidentally, the S&P 500 is hitting all-time highs, indicating that rising stock markets benefit consumers with the largest stock portfolios but leave behind consumers with smaller portfolios.
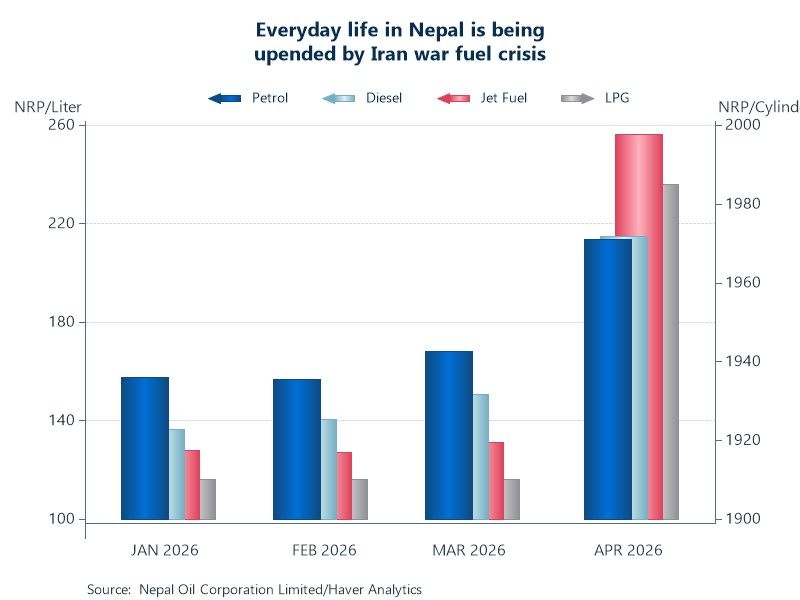
ENERGY → Petroleum → Petroleum Product Prices Including Pump Prices → Nepal
Retail fuel prices for Nepal were added to the ENERGY, INTDAILY and INTWKLY databases. Fuels included in this table are petrol, diesel, kerosene, liquefied petroleum gas and jet fuel. These 7-day daily data are sourced from the Nepal Oil Corporation (NOC) and start in November 2017.
Chart: Arguably, nowhere has felt the effects of the war in Iran more than Asia, as nearly 90% of the oil and gas passing through the Strait of Hormuz is bound for Asian countries. Nepal imports all its fuel from India – and thus these disruptions have caused steep price hikes, widespread shortages, and has forced the state-owned NOC into massive financial losses as they absorb some of the blow to consumers through subsidies. In the past two months, the price of petrol has increased by 36%, diesel by 53% and jet fuel by 102%. Natural gas, which is considered an essential household utility, has only seen a 4% increase primarily due to subsidies.
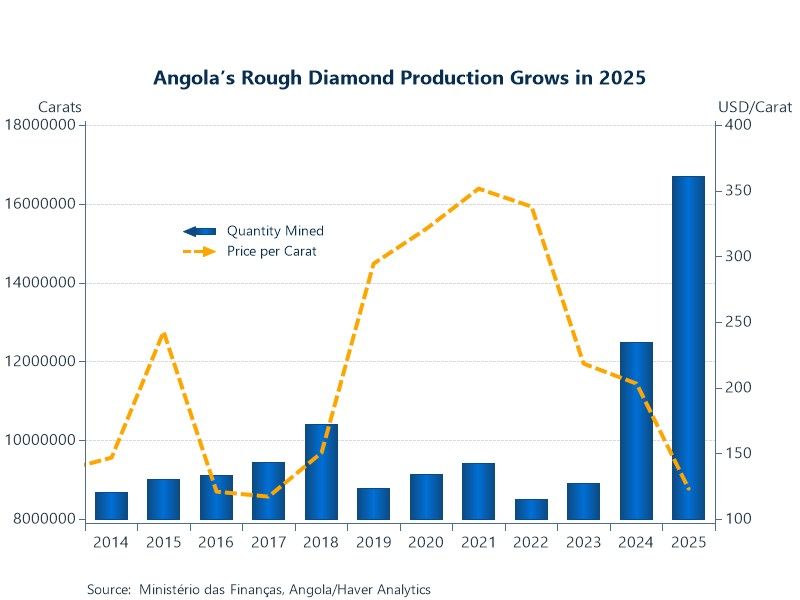
GLSECTOR → Selected Indicators by Country → Angola → Mining → Diamond Mining
Diamond mining statistics for Angola have been added to the GLSECTOR database. Series include carats of diamonds produced, average price per carat, and industrial taxes and royalties collected. These monthly data are sourced from the Angola Ministry of Finance and start in January 2001.
Chart: Despite fragile global demand and competition from synthetic diamonds, Angola continues to break production records, mining 16.7 million carats in 2025, an increase of 33.9% YoY following a 40.2% increase in 2024. These gains have made Angola one of the world’s top diamond producers by value. It has deliberately traded volume for value by offloading large inventories of diamonds onto the global market. However, this has driven the average price per carat down 39% YoY to $123.21 – and further down to $85.33 in Feb 2026.
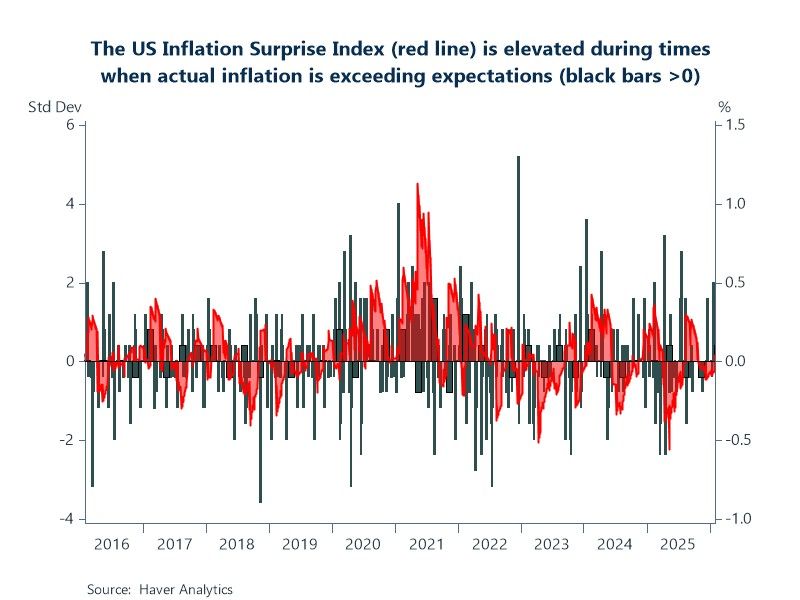
INTDAILY → Americas → United States → US Surprise Indexes
Haver-calculated US Economic Surprise Indexes were added to INTDAILY and DAILY. The series are based on the Action Economics median forecasts relative to the corresponding as first reported figures. The series cover key economic concepts and sectors including GDP, production and capacity, current account and trade, consumers, housing, labor and inflation. Economic growth, hard and soft data aggregates are also available. Daily data start in May 2004.
Chart: A 10-year snapshot of the inflation surprise index (red) plotted against the differences between as reported and expected values for the underlying inflation indicators. In this case, they are CPI, PPI, import prices, and the ECI. The surprise index is in positive territory during times when the concentration of instances when actual inflation exceeds expectations is greater.
More Featured Data Additions
 Global| May 15 2026
Featured Data Additions, May 15, 2026
 Global| May 06 2026
Featured Data Additions, May 6, 2026
 Global| May 01 2026
Featured Data Additions, May 1, 2026
 Global| Apr 24 2026