 Global| May 01 2026
Featured Data Additions, May 1, 2026
CNTRADE → Motor Vehicle Exports
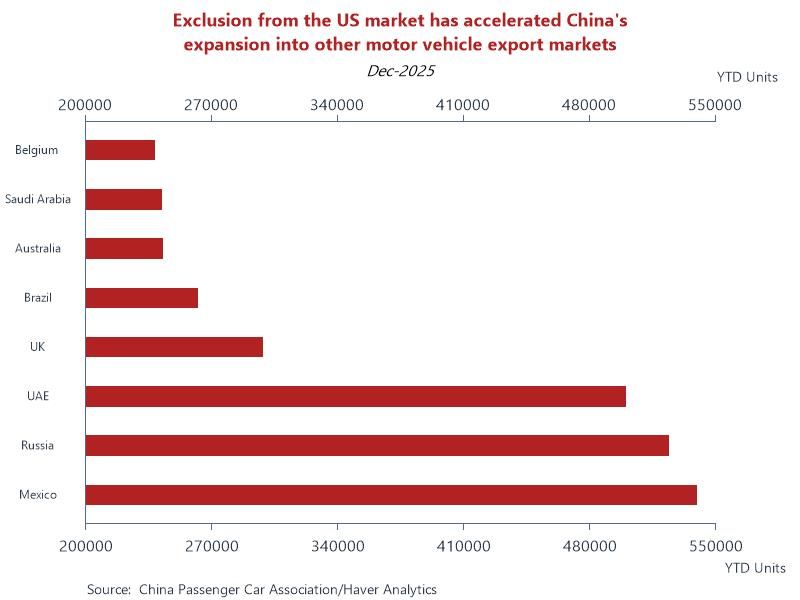
Motor vehicle exports detail for China was added to the CNTRADE database. These data, reported in number of vehicles, are available for 21 of China’s motor vehicle export markets. Monthly data are sourced from the China Passenger Car Association and start in April 2024.
Chart: China is currently the world’s largest exporter of motor vehicles. Exports have increased by multiple factors, from under 1 million in 2020 to around 8 million in 2025, essentially increasing 7-8 times over 5 years. In 2025, the top countries importing cars from China were Mexico, Russia, and the UAE, with Mexico importing over 539,000 units. US tariffs and other restrictions have forced Chinese automakers to pivot, driving a massive surge in vehicle exports to alternative markets in Europe, Latin America, SE Asia and the Middle East.
ANZ → Australia → Business Cycle Indicators and Surveys → Consumer Sentiment Index and Components
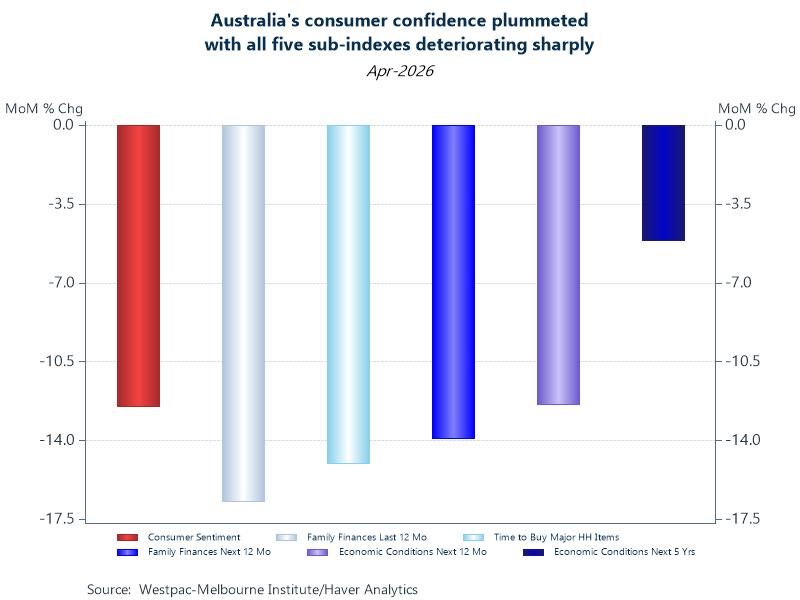
Growth rates for all Australian consumer sentiment series were added to the ANZ and ANZR databases. These growth rates were calculated by Haver Analytics using the full decimal precision data. The monthly underlying indexes are sourced from the Westpac-Melbourne Institute and start in October 1974 for the main series and March 1996 for the demographic detail.
Chart: Australians’ confidence took its biggest hit since the pandemic’s darkest days. In its latest consumer confidence survey, Westpac-Melbourne Institute found that sentiment crashed 12.5% to 80.1 in April. A score above 100 is considered optimistic about the future. All five sub-indexes deteriorated sharply in April, especially those measuring the current conditions. Surging fuel costs weighed particularly heavy on the family finance index (last 12 months) which plunged 16.7% YoY to 66.8.
GLSECTOR → Agriculture and Fishing → Brazil
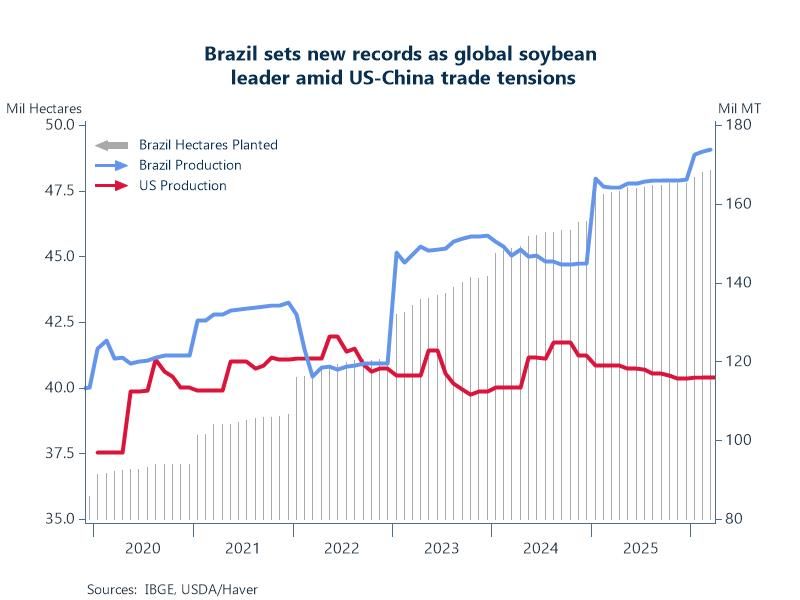
Agricultural statistics for Brazil were added to GLSECTOR. Concepts include planted hectares, harvested hectares, production in MT and average kilos per hectare – available for approximately 30 agricultural commodities. Monthly data are sourced from the IBGE and start in September 2006.
Chart: Brazil is poised to further cement its status as the leading player in the global soybean market, achieving record shares in production. It is expected to harvest an all-time high of 174 million MT of soybeans from nearly 50 million planted hectares this season. This output would account for more than 42% of global production, up from 30% a decade ago. The US, which once supplied over 60% of the world’s soybeans, has seen its share decline. US production is expected to reach 116 million MT this year, only 27% of global production.
SPAIN → Demographics → Immigration and Emigration by Countries
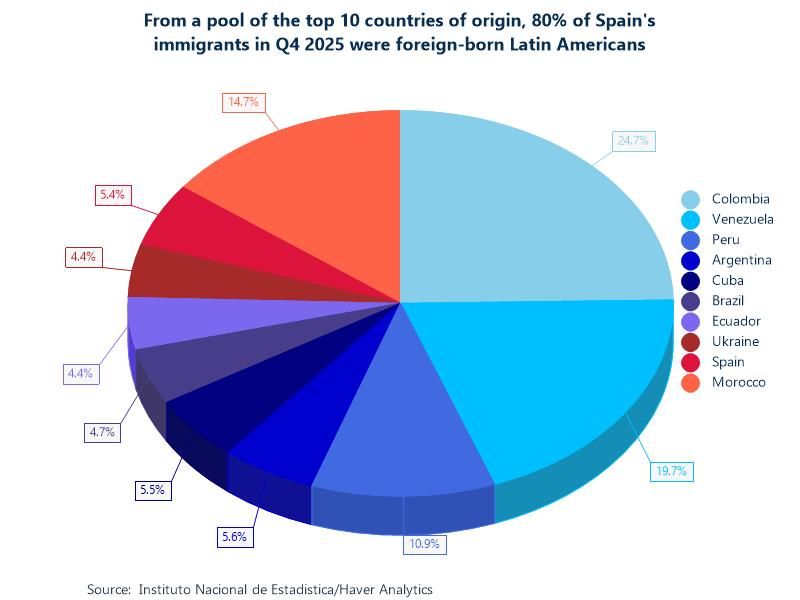
Immigration and emigration statistics for Spain were added to the SPAIN database. The top ten countries of origin and destination are reported with every release by nationality and by country of birth. Quarterly data are sourced from the Instituto Nacional de Estadistica and start in Q1 2023.
Chart: Latin American immigrants in Spain exceed any other group and constitute one of the most striking features of Spain’s immigration composition. Drivers for this are visa exemptions and ease of obtaining Spanish nationality for most Latin Americans, the resulting network effect and reuniting of families. Latin Americans’ linguistic and religious affinities to the bulk of the Spanish population creates a very different social context to the one prevailing in other Western European countries, where Asia and Africa are the main source of non-EU immigration.
More Featured Data Additions
 Global| Jun 17 2026
Featured Data Additions, June 17, 2026
 Global| Jun 12 2026
Featured Data Additions, June 12, 2026
 Global| Jun 03 2026
Featured Data Additions, June 3, 2026
 Global| May 27 2026