House prices are strong in the UK. Today's Halifax [HBOS] data show an 11.2% advance for March over a year ago, with a 1.1% rise in March alone. Both new and existing homes are experiencing the same general pattern, with new houses [...]
 Global| Apr 05 2007
UK House Prices Up 11% in March; Increase Is Especially Large in Northern Ireland
House prices are strong in the UK. Today's Halifax [HBOS] data show an 11.2% advance for March over a year ago, with a 1.1% rise in March alone. Both new and existing homes are experiencing the same general pattern, with new houses [...]
- Global| Apr 04 2007
India Balance of Payments Sees Dynamic Trade and Investment Flows, with Record Reserve Accumulation in 2006
India's balance of payments shows an unusual amount of two-way flow in both current and financial accounts. In Q4 2006 this encompassed a variety of distinctive movements. The trade deficit widened, continuing to confound many [...]
- Global| Apr 04 2007
U.S. Factory Orders Continue to Disappoint
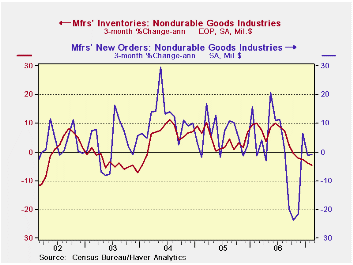 Each month the factory order report is a re-issue of durable goods from the week before with (usually) minor revisions plus a new look at nondurable goods shipments and inventories. This month the durable goods order gain was trimmed from a small rise of 2.5% to an even tinier rise of 1.7% for February following a plunge in January. The new data for February are for nondurable goods. Orders there rose by a meager 0.2% in the month. Over three months they are weak with shipments dropping by 1%. But the good news is that progress on inventory reduction is in train as inventories dropped by 4.4% in February.
The overall trends for the factory sector cut into three month blocks shows some revival in shipments compared to past trends. And there is a relatively sharp fall off in (still high) unfilled orders. Inventories are undergoing a gradual slowing in their build up. New orders continue to drop and at a slightly accelerated pace.
Each month the factory order report is a re-issue of durable goods from the week before with (usually) minor revisions plus a new look at nondurable goods shipments and inventories. This month the durable goods order gain was trimmed from a small rise of 2.5% to an even tinier rise of 1.7% for February following a plunge in January. The new data for February are for nondurable goods. Orders there rose by a meager 0.2% in the month. Over three months they are weak with shipments dropping by 1%. But the good news is that progress on inventory reduction is in train as inventories dropped by 4.4% in February.
The overall trends for the factory sector cut into three month blocks shows some revival in shipments compared to past trends. And there is a relatively sharp fall off in (still high) unfilled orders. Inventories are undergoing a gradual slowing in their build up. New orders continue to drop and at a slightly accelerated pace.
Sector detail for nondurables shows a lot of weakness. Beverages are weak as are the Textile Mill and Product sectors. For Textiles inventory reduction is being achieved at a very rapid pace. Apparel has just turned positive and Leather Goods shows considerable strength. Paper Products and Printing are weak with shipments declining. Petroleum & Coal and Plastics & Rubber also are seeing shipment declines. Basic Chemicals and Pharmaceuticals & Medicines have turned sharply positive.These are the readings that are new in the day’s report. They are hardly encouraging.
Factory OrdersFactory Orders 3Mo 6Mo 9Mo 12Mo Year Ago Shipments -3.5% -9.4% -5.6% -1.0% 6.6% New Orders -9.0% -7.8% -4.9% -0.8% 7.1% Unfilled Orders 14.5% 23.6% 20.3% 20.8% 17.0% Inventories 1.0% 2.8% 5.0% 6.4% 2.5% Nondurable goods 3Mo 6Mo 9Mo 12Mo Year Ago Shipments -1.0% -11.8% -7.8% -1.3% 5.0% Inventories -4.4% -3.3% 0.2% 2.2% 4.0% Nondurable Goods: Orders and Inventories by Industry Food Products 3Mo 6Mo 9Mo 12Mo Year Ago Shipments 1.7% 1.2% 2.0% 0.5% 0.9% Inventories -0.9% 6.3% 6.3% 4.5% 4.3% Beverages 3Mo 6Mo 9Mo 12Mo Year Ago Shipments -20.7% -12.9% -7.4% 0.1% 7.4% Inventories 3.0% 3.2% 1.3% -0.7% 4.2% Textile Mills 3Mo 6Mo 9Mo 12Mo Year Ago Shipments -3.6% -2.4% -3.0% -3.1% -12.6% Inventories -25.3% -16.2% -8.1% -8.8% -7.9% Textile Products 3Mo 6Mo 9Mo 12Mo Year Ago Shipments -4.1% -8.6% -11.9% -8.5% 3.9% Inventories -11.6% -9.2% -1.3% -2.6% -0.6% Apparel 3Mo 6Mo 9Mo 12Mo Year Ago Shipments 0.8% 3.7% -8.6% -1.9% 8.0% Inventories 7.4% -22.6% -12.4% -9.2% -1.1% Leather & Allied Products 3Mo 6Mo 9Mo 12Mo Year Ago Shipments 105.8% 14.9% 16.7% 10.1% -2.9% Inventories 23.4% 7.4% 15.1% 11.9% -9.0% Paper Products 3Mo 6Mo 9Mo 12Mo Year Ago Shipments -2.6% -5.5% -5.3% -1.5% 1.1% Inventories 5.8% 2.9% 0.4% 1.9% -1.9% Printing 3Mo 6Mo 9Mo 12Mo Year Ago Shipments -7.0% 0.4% 1.1% 3.5% -3.1% Inventories -15.8% -16.6% -2.0% 0.7% -2.1% Petroleum&Coal 3Mo 6Mo 9Mo 12Mo Year Ago Shipments -1.3% -32.7% -23.7% -5.3% 17.2% Inventories -15.5% -30.4% -19.2% 4.5% 16.3% Basic Chemicals 3Mo 6Mo 9Mo 12Mo Year Ago Shipments 4.7% -10.3% -5.9% 0.2% 4.0% Inventories -0.4% -1.0% 1.7% 1.9% 2.9% Pharmaceuticals & Medicine 3Mo 6Mo 9Mo 12Mo Year Ago Shipments 19.6% -6.5% -6.8% 6.3% -1.0% Inventories -7.4% -1.1% 5.5% 11.0% -4.6% Plastics & Rubber Products 3Mo 6Mo 9Mo 12Mo Year Ago Shipments -6.6% -12.5% -7.0% -3.7% 7.0% Inventories 6.5% 5.0% 1.0% 0.7% 4.6% - Global| Apr 04 2007
Nonmanufacturing ISM: Sharp Two-Month Drop Off
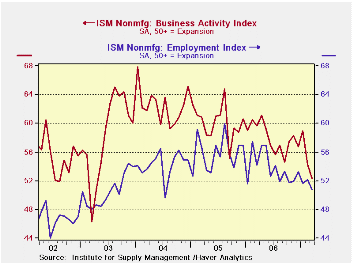 ISM trends show a weakening trend in the services-mining-construction sector of the economy to add to the lethargy in manufacturing. The past two months show that the index has dropped to a much lower profile than before. This is the weakest activity recorded since early 2003. Employment trend has been ground into a lower profile as well. The results are disconcerting although it may be that ongoing construction problems are weighing on the index and services are not as weak as the index suggests.
An analysis of the position of the various ISM components in their respective ranges shows that weakness characterizes this sector. Both activity and orders are below their range midpoints and below their period average values. Order backlogs continue to appear strong as an offset, as we have seen in durable goods order report. Unlike the ISM manufacturing we see that export and import services are weak. For manufacturing these two series were quite firm. Price readings rose in the month and remain firm in their historic range. On balance, the nonmanufacturing sector does not appear to be as strong or supportive of the economy as it once was. It raises the question of whether the weakness in manufacturing and construction industries has ground down the once vibrant services sector that is nested within the nonmanufacturing ISM.
ISM Nonmanufacturing Statistics from January 1998 to DateISM-NMFG Current Std Dev Average SD %Avg MAX MIN Range Percentile % of AVG PM Activity 52.4 4.7 57.5 8.2 67.9 40.5 27.4 43.4 91 New Orders 53.8 4.7 57.2 8.2 66.9 41.3 25.6 48.8 94 Backlogs 52.5 3.7 51.0 7.2 57.0 40.5 16.5 72.7 103 Supplier Deliveries 50.0 2.1 53.6 4.0 60.5 48.0 12.5 16.0 93 Inventory Sentiment 63.0 2.7 63.1 4.3 69.0 55.0 14.0 57.1 100 Inventories 52.0 3.2 50.5 6.2 59.0 43.5 15.5 54.8 103 Prices 63.3 8.3 59.8 13.9 80.5 41.3 39.2 56.1 106 Employment 50.8 3.7 51.7 7.1 59.9 43.9 16.0 43.1 98 Export Orders 48.5 4.5 54.8 8.3 64.0 44.5 19.5 20.5 89 Import Orders 50.0 4.0 54.7 7.4 63.5 45.5 18.0 25.0 91 - Global| Apr 04 2007
Nonmanufacturing ISM: Sharp Two-Month Drop Off
ISM trends show a weakening trend in the services-mining-construction sector of the economy to add to the lethargy in manufacturing. The past two months show that the index has dropped to a much lower profile than before. This is the weakest activity recorded since early 2003. Employment trend has been ground into a lower profile as well. The results are disconcerting although it may be that ongoing construction problems are weighing on the index and services are not as weak as the index suggests.
An analysis of the position of the various ISM components in their respective ranges shows that weakness characterizes this sector. Both activity and orders are below their range midpoints and below their period average values. Order backlogs continue to appear strong as an offset, as we have seen in durable goods order report. Unlike the ISM manufacturing we see that export and import services are weak. For manufacturing these two series were quite firm. Price readings rose in the month and remain firm in their historic range. On balance, the nonmanufacturing sector does not appear to be as strong or supportive of the economy as it once was. It raises the question of whether the weakness in manufacturing and construction industries has ground down the once vibrant services sector that is nested within the nonmanufacturing ISM.
ISM Nonmanufacturing Statistics from January 1998 to Date
U.S. Factory Orders Continue to DisappointISM-NMFG Current Std Dev Average SD %Avg MAX MIN Range Percentile % of AVG PM Activity 52.4 4.7 57.5 8.2 67.9 40.5 27.4 43.4 91 New Orders 53.8 4.7 57.2 8.2 66.9 41.3 25.6 48.8 94 Backlogs 52.5 3.7 51.0 7.2 57.0 40.5 16.5 72.7 103 Supplier Deliveries 50.0 2.1 53.6 4.0 60.5 48.0 12.5 16.0 93 Inventory Sentiment 63.0 2.7 63.1 4.3 69.0 55.0 14.0 57.1 100 Inventories 52.0 3.2 50.5 6.2 59.0 43.5 15.5 54.8 103 Prices 63.3 8.3 59.8 13.9 80.5 41.3 39.2 56.1 106 Employment 50.8 3.7 51.7 7.1 59.9 43.9 16.0 43.1 98 Export Orders 48.5 4.5 54.8 8.3 64.0 44.5 19.5 20.5 89 Import Orders 50.0 4.0 54.7 7.4 63.5 45.5 18.0 25.0 91
by Robert Brusca April 4, 2007
Each month the factory order report is a re-issue of durable goods from the week before with (usually) minor revisions plus a new look at nondurable goods shipments and inventories. This month the durable goods order gain was trimmed from a small rise of 2.5% to an even tinier rise of 1.7% for February following a plunge in January. The new data for February are for nondurable goods. Orders there rose by a meager 0.2% in the month. Over three months they are weak with shipments dropping by 1%. But the good news is that progress on inventory reduction is in train as inventories dropped by 4.4% in February.
The overall trends for the factory sector cut into three month blocks shows some revival in shipments compared to past trends. And there is a relatively sharp fall off in (still high) unfilled orders. Inventories are undergoing a gradual slowing in their build up. New orders continue to drop and at a slightly accelerated pace.
Sector detail for nondurables shows a lot of weakness. Beverages are weak as are the Textile Mill and Product sectors. For Textiles inventory reduction is being achieved at a very rapid pace. Apparel has just turned positive and Leather Goods shows considerable strength. Paper Products and Printing are weak with shipments declining. Petroleum & Coal and Plastics & Rubber also are seeing shipment declines. Basic Chemicals and Pharmaceuticals & Medicines have turned sharply positive.These are the readings that are new in the day’s report. They are hardly encouraging.
Factory Orders
India Balance of Payments Sees Dynamic Trade and Investment Flows, with Record Reserve Accumulation in 2006Factory Orders 3Mo 6Mo 9Mo 12Mo Year Ago Shipments -3.5% -9.4% -5.6% -1.0% 6.6% New Orders -9.0% -7.8% -4.9% -0.8% 7.1% Unfilled Orders 14.5% 23.6% 20.3% 20.8% 17.0% Inventories 1.0% 2.8% 5.0% 6.4% 2.5% Nondurable goods 3Mo 6Mo 9Mo 12Mo Year Ago Shipments -1.0% -11.8% -7.8% -1.3% 5.0% Inventories -4.4% -3.3% 0.2% 2.2% 4.0% Nondurable Goods: Orders and Inventories by Industry Food Products 3Mo 6Mo 9Mo 12Mo Year Ago Shipments 1.7% 1.2% 2.0% 0.5% 0.9% Inventories -0.9% 6.3% 6.3% 4.5% 4.3% Beverages 3Mo 6Mo 9Mo 12Mo Year Ago Shipments -20.7% -12.9% -7.4% 0.1% 7.4% Inventories 3.0% 3.2% 1.3% -0.7% 4.2% Textile Mills 3Mo 6Mo 9Mo 12Mo Year Ago Shipments -3.6% -2.4% -3.0% -3.1% -12.6% Inventories -25.3% -16.2% -8.1% -8.8% -7.9% Textile Products 3Mo 6Mo 9Mo 12Mo Year Ago Shipments -4.1% -8.6% -11.9% -8.5% 3.9% Inventories -11.6% -9.2% -1.3% -2.6% -0.6% Apparel 3Mo 6Mo 9Mo 12Mo Year Ago Shipments 0.8% 3.7% -8.6% -1.9% 8.0% Inventories 7.4% -22.6% -12.4% -9.2% -1.1% Leather & Allied Products 3Mo 6Mo 9Mo 12Mo Year Ago Shipments 105.8% 14.9% 16.7% 10.1% -2.9% Inventories 23.4% 7.4% 15.1% 11.9% -9.0% Paper Products 3Mo 6Mo 9Mo 12Mo Year Ago Shipments -2.6% -5.5% -5.3% -1.5% 1.1% Inventories 5.8% 2.9% 0.4% 1.9% -1.9% Printing 3Mo 6Mo 9Mo 12Mo Year Ago Shipments -7.0% 0.4% 1.1% 3.5% -3.1% Inventories -15.8% -16.6% -2.0% 0.7% -2.1% Petroleum&Coal 3Mo 6Mo 9Mo 12Mo Year Ago Shipments -1.3% -32.7% -23.7% -5.3% 17.2% Inventories -15.5% -30.4% -19.2% 4.5% 16.3% Basic Chemicals 3Mo 6Mo 9Mo 12Mo Year Ago Shipments 4.7% -10.3% -5.9% 0.2% 4.0% Inventories -0.4% -1.0% 1.7% 1.9% 2.9% Pharmaceuticals & Medicine 3Mo 6Mo 9Mo 12Mo Year Ago Shipments 19.6% -6.5% -6.8% 6.3% -1.0% Inventories -7.4% -1.1% 5.5% 11.0% -4.6% Plastics & Rubber Products 3Mo 6Mo 9Mo 12Mo Year Ago Shipments -6.6% -12.5% -7.0% -3.7% 7.0% Inventories 6.5% 5.0% 1.0% 0.7% 4.6%
by Carol Stone April 4, 2007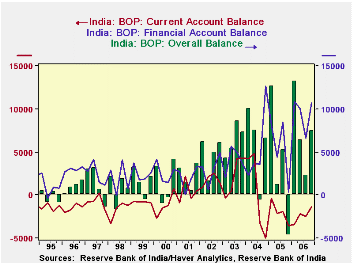
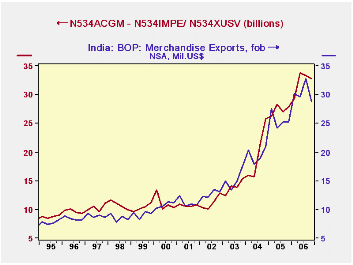
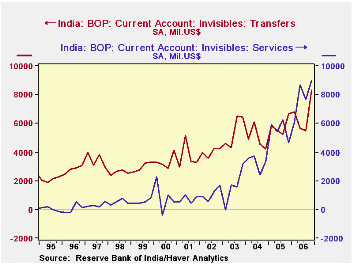
India's balance of payments shows an unusual amount of two-way flow in both current and financial accounts. In Q4 2006 this encompassed a variety of distinctive movements. The trade deficit widened, continuing to confound many observers' preconceptions that India shouldn't have a deficit in this account at all. Petroleum is apparently the main cause, as suggested by the second graph here. It shows merchandise imports less petroleum plotted with merchandise exports, and these two quantities have roughly the same magnitudes.
The overall current account is much more near balance, as sizable surpluses in services and unilateral transfers offset much of the trade shortfall. In fact, the net on services in Q4, right at $9.0 billion, is nearly twice as much as it was in Q4 of 2005. This is the numerical result of the "outsourcing" of many business service activities by companies elsewhere in the world. Many Indians work abroad and send money home. Private transfers in Q4 were $7.9 billion, up $1.5 billion from the same period a year ago. The balances on services and transfers were both record amounts.
Capital accounts feature sizable -- unprecedented -- direct investment flows in BOTH directions. Foreign firms acquired Indian companies and Indian companies made acquisitions abroad. Foreign investors also increased their portfolio holdings, as they bought into the Indian stock market. Other capital account transactions, including bank loans and bank deposits and assorted other kinds of lending also showed great fluidity: Indian banks made sizable loans abroad, while nonbank lending to India grew sharply.
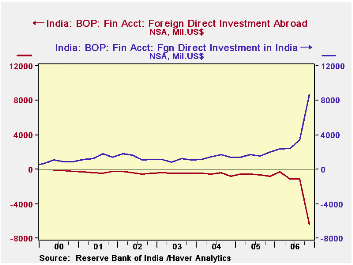
All together, the "overall balance" in Q4 was $7.5 billion, with a commensurate increase in foreign exchange reserves. This is sizable, and such numbers are getting to be common. For 2006 as a whole, the balance totaled $29.4 billion, also a record. Such accumulations of foreign exchange will enable more flows abroad, such as the outward investments recently seen.
Haver's data on India is contained in the EMERGEPR database.
INDIA1: Mil.US$ Q4 2006 Q3 2006 Q4 2005 2006 2005 2004 Current Account2,3 -1,321 -2,465 -3,549 -10,006 -7,810 +781 Merchandise Trade2 -18,251 -14,346 -12,400 -63,783 -46,872 -28,036 Services2 +8,995 +7,650 +4,643 +31,428 +22,259 +13,076 Transfers2 +8,282 +5,503 +6,631 +26,290 +23,234 +19,793 Direct Investment in India +8,669 +3,414 +2,002 +16,888 +6,663 +5,771 Direct Investment Abroad -6,388 -1,146 -784 -9,029 -2,487 -2,179 Portfolio Investment +3,556 +2,141 +2,748 +9,503 +12,144 +9,037 Overall Balance3 +7,507 +2,268 -4,672 +29,372 +14,460 +23,601 - Global| Apr 03 2007
Profitability of U.K. Private Nonfinancial Corporations at a Record High: Largely a Reflection of the [...]
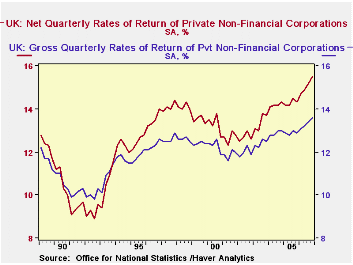 The net profitability of all private nonfinancial corporations in the United Kingdom was 15.5% in the fourth quarter of 2006. This rate was up from 15.2% in the third quarter and was the highest quarterly rate since the series began in the first quarter of 1989, as can be seen in the first chart, which shows net and gross profitability of U.K. corporations.
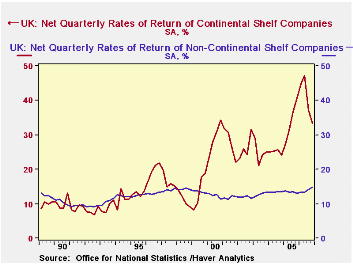 Net profitability is defined as the net rate of return on capital employed. That is, it is the value of profits, allowing for depreciation, divided by the value of inventories and the depreciated value of fixed assets. Gross profitability is defined as the gross return on capital employed, that is, the value of profits before depreciation charges divided by the value of inventories and fixed assets before depreciation . These tend to be lower than the net rates of return, as shown in the first chart.
While the net profitability of Continental Shelf companies (companies engaged in the extraction of oil and gas) declined to 33.5% from 37.3% in the third quarter, the profitability of the nonshelf companies rose to 14.7% from 14.2% in the third quarter. The rates of return for the Continental Shelf corporations are more volatile than those of the nonshelf corporations as can be seen in the second chart. The volatility of the Continental Shelf corporations is due, in large part, to variations in the prices of oil and gas.
Net profitability is defined as the net rate of return on capital employed. That is, it is the value of profits, allowing for depreciation, divided by the value of inventories and the depreciated value of fixed assets. Gross profitability is defined as the gross return on capital employed, that is, the value of profits before depreciation charges divided by the value of inventories and fixed assets before depreciation . These tend to be lower than the net rates of return, as shown in the first chart.
While the net profitability of Continental Shelf companies (companies engaged in the extraction of oil and gas) declined to 33.5% from 37.3% in the third quarter, the profitability of the nonshelf companies rose to 14.7% from 14.2% in the third quarter. The rates of return for the Continental Shelf corporations are more volatile than those of the nonshelf corporations as can be seen in the second chart. The volatility of the Continental Shelf corporations is due, in large part, to variations in the prices of oil and gas.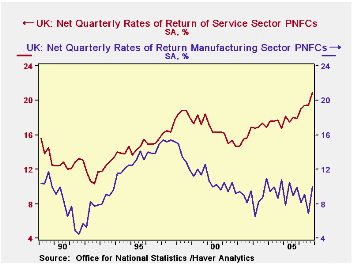
Of the nonshelf companies, it is the corporations engaged in the service industries that have accounted for the rise in the overall profitability of the private nonfinancial companies. Net profitability in the service and manufacturing industries are compared in the third chart. Rates of return in the manufacturing industry tend to be lower than those in the service industries due, in part, to the greater capital intensity of the manufacturing industry relative to that of the service industry corporations, but the gap between rates of return in the manufacturing and service industries has widened as profitability in the service industries has improved and that in the manufacturing industries deteriorated.
NET PROFITABILITY OF PRIVATE NON FINANCIAL CORPORATIONS IN THE UK (%) Q4 2006 Q3 2006 Q4 2005 Q/Q Dif Y/Y Dif 2006 2005 2004 All Corporations 15.5 15.2 14.3 0.3 1.2 15.1 14.3 14.2 Continental Shelf Corporations 33.5 37.3 40.6 -3.8 -7.1 40.7 34.1 25.1 Nonshelf Corporations 14.7 14.2 13.0 0.5 1.7 13.9 13.4 13.5 Manufacturing Corporations 10.0 6.9 9.9 3.1 0.1 8.5 9.3 9.7 Service Industry Corporations 20.9 19.5 17.9 1.4 3.0 19.7 17.9 17.4 - Global| Apr 03 2007
Euro Area and UK PPI Trends
Euro area and UK PPI Trends· The Euro area 13 PPI rose by 0.3% in February. Excluding energy the rise was 0.3% as well. Trends show that PPI inflation pressures are elevated. And while the PPI is not the main focus of ECB policy, the pressure on prices is widespread across main EU countries. The bank of England has even recently said it was going to look beyond headline inflation as legacy issues might damp that calculation in the coming months. Central banks are becoming more concerned about embedded inflation pressures. M/M SAAR Euro area 13 Feb-07 Jan-07 3-Mo 6-MO Yr/Yr Total (Excl Construction) 0.3% 0.2% 2.1% 0.2% 2.9% yes"> Excl Energy
0.3% 0.5% 3.4% 2.7% 3.4% Capital Goods 0.1% 0.5% 2.9% 2.3% 2.0% Consumer Goods 0.2% 0.3% 2.4% 1.2% 1.6% Intermediate & Capital Goods 0.3% 0.6% 3.9% 3.4% 4.4% Energy 0.4% -0.7% -1.8% -7.5% 1.0% Manufacturing 0.4% 0.1% 2.3% -0.4% 2.5% Germany 0.3% 0.0% 1.0% 0.3% 2.8% yes"> Excl Energy
0.3% 0.2% 2.2% 2.4% 3.0% France 0.3% 0.1% 1.1% -0.7% 2.0% yes"> Excl Energy
0.2% 0.5% 2.2% 1.9% 2.8% Italy 0.4% 0.0% 2.4% 0.2% 4.0% yes"> Excl Energy
0.3% 0.6% 4.3% 3.0% 4.2% UK -0.8% -1.4% -6.7% 1.4% -1.4% yes"> Excl Energy
0.4% 0.5% 3.7% 3.1% 3.4% Euro area 13 Harmonized PPI excl Construction. The EA 13 countries are Austria, Belgium, Finland, France, Germany, Greece, Ireland, Italy, Luxembourg, the Netherlands, Portugal, Slovenia and Spain 6COLSPAN
Trend across categories and countries do not show a steadily accelerating inflation rate that central banks would clearly abhor. But they do show that pressures that had dissipated have re-emerged in the 3-month inflation rates. Excluding energy, inflation trends across the main countries show the same tendency except in Germany and in France where the pace of PPI ex-energy inflation is staying fairly constant, just above the 2% pace.
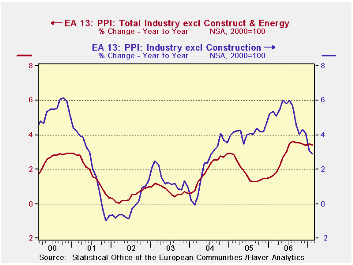
The headline inflation rate is moving steadily lower, but ex-energy inflation is considerably more stubborn around 3.5%, well above the ECB ceiling rate of 2% (for the HICP).
- of9Go to 8 page