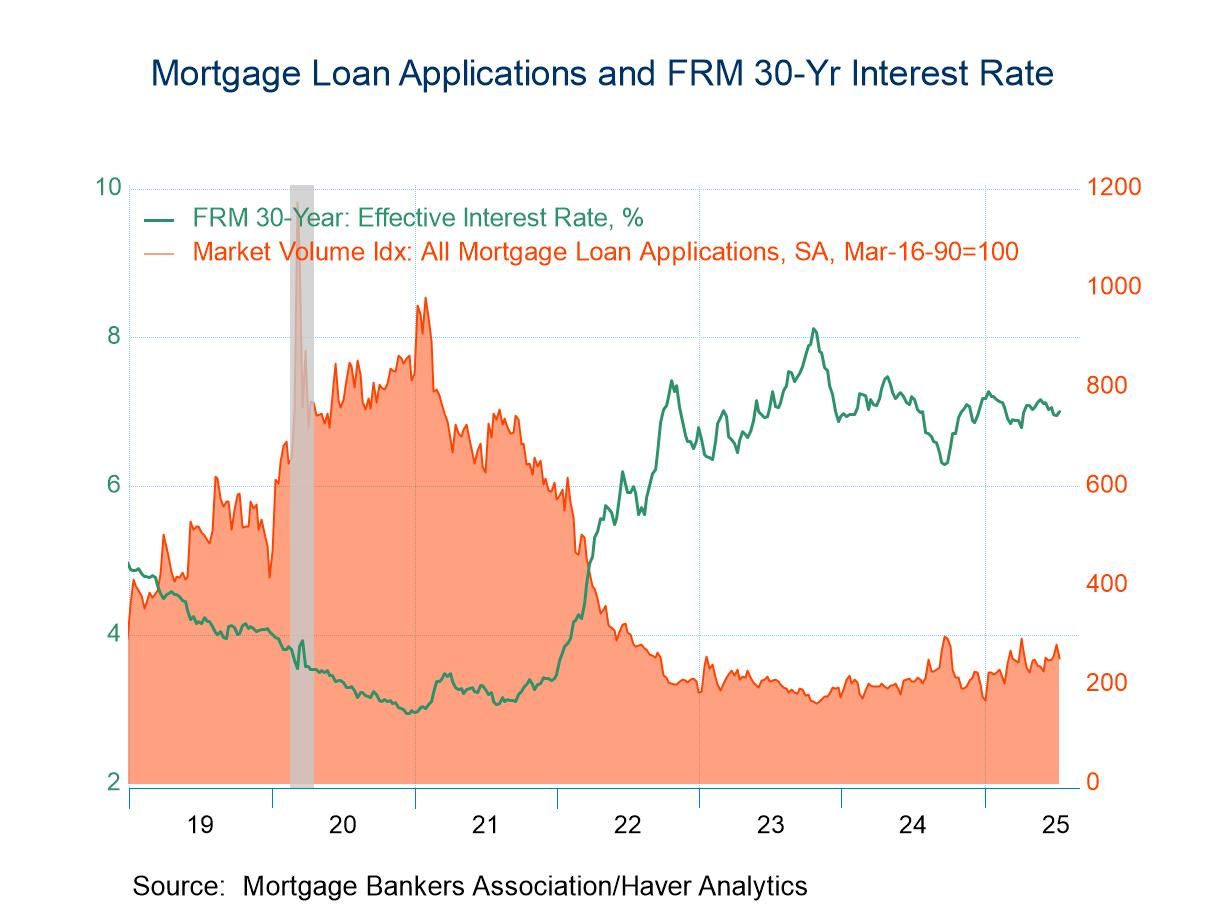
- Both purchase applications and refinancing loan applications fell in July 11 week.
- Effective interest rate on 30-year fixed-rate loans rose to 7.0%.
- Average loan size declines for the fourth time in five weeks.
 USA| Jul 16 2025
U.S. Mortgage Applications Dropped 10.0% in the Latest Week
 United Kingdom| Jul 16 2025
U.K. CPIH Inflation Runs Hot
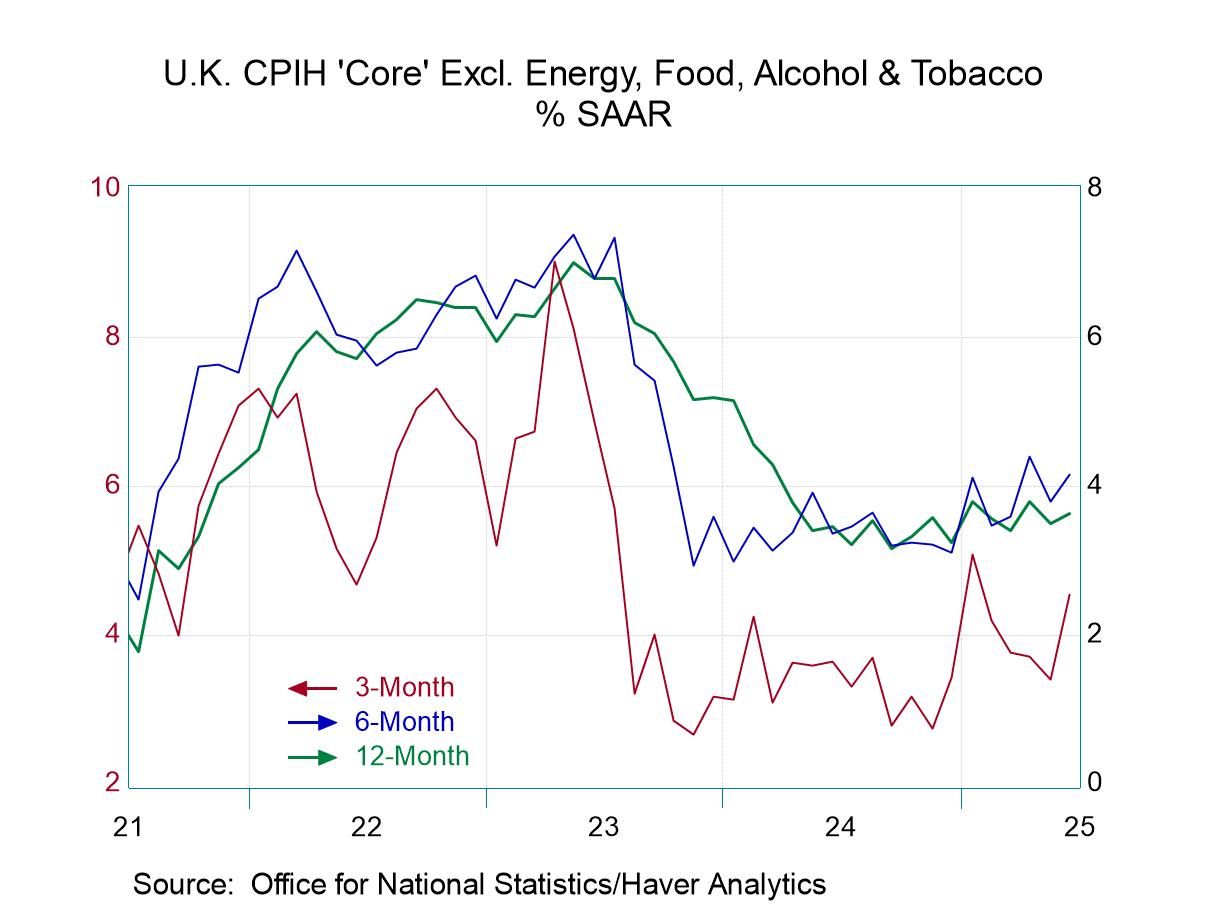
Inflation in the United Kingdom is still running hot in June. The CPIH rose by 0.4% in the month with its core rate that excludes energy, food, alcoholic beverages & tobacco also rising 0.4% month-to-month. In both cases, these increases compare to a rise of 0.1% in May. On that perspective, the two-month trend is somewhat muted. However, in April the CPIH headline rose by 0.6% and the core rose by 0.4%, so the U.K. finds itself in another period of excess inflation.
Sequential inflation The sequential inflation rate from 12-months to six-months to three-months shows the headline at 4.1% over 12 months, 4.2% over six months and 4.3% over three months, a very slight acceleration, but clearly inflation that is over 2 percentage points above the target set by the Bank of England across the entire span. The core rate for the CPIH is up 4.3% over 12 months, up at a 4.4% annual rate over six months and looks slightly muted at 4.2% over three months. Again, we are looking at a solid inflation overshoot that is more than 2 percentage points above the target set by the Bank of England.
Inflation breadth In the month of June, inflation accelerated in 45% of the categories, the same proportion as in May; however, in April acceleration occurred in 54% of the categories. These sequential data show that over three months inflation in the U.K. accelerated across 54% of the categories, the same proportion as over six months although both of those marks were below the 63% acceleration breadth logged over 12 months. The data clearly show that there isn't any deceleration to any great extent in play over any of these horizons and that the monthly data offer only a modicum of solace for June and May.
The far-right hand column evaluates current inflation rates year-over-year compared to where they have been since January 2000, monthly. The comparison is a ranked percentage of the current inflation rate vs. this history. For example, the current CPIH 12-month inflation rate of 4.1% sits at the 88.6 percentile of its historic queue of data. This tells us that inflation has been this high or higher, less than 12% of the time over this period, clearly marking the 4.1% growth rate as high and as substantial by historic experience. The CPIH core has a slightly higher standing and it's 89th percentile. Looking across the components, all but two have rankings over this 50%. Rankings that are above 50% place them above their medians for the period. The exceptions here, are a 26.5 percentile standing for restaurants & hotels inflation where prices are running at 2.6%, and transportation where prices are running at 1.6%. Furniture, household equipment & maintenance prices have a 56.2 percentile standing, only marginally above the category’s historic median. After that, there's only one category in its 60th percentile, two categories in their 70th percentile and the rest are higher.
Summing up Needless to say, the U.K. has an entrenched inflation problem. It's lodged in the headline; it's lodged in the core; it's lodged across most of the commodity categories! The Bank of England simply has work to do and there isn't much evidence that the BOE is making any progress; in fact, the trends seem to suggest that there may be much more work to do.
 USA| Jul 15 2025
U.S. Consumer Price Index Strengthens in June
- Monthly increase is highest in five months. Core gain moves up minimally.
- Energy costs post solid increase.
- Both core goods and core services prices move higher.
by:Tom Moeller
|in:Economy in Brief
 USA| Jul 15 2025
FRBNY Empire State Manufacturing Index Jumped 22 points in July
- The first positive reading for the index since February.
- The July jump reflected widespread increases across components.
- Evidence of some nascent supply-chain problems.
- Outlook six months ahead continues to brighten.
by:Sandy Batten
|in:Economy in Brief
 USA| Jul 15 2025
U.S. Energy Prices Remain Mixed in Latest Week
- Gasoline prices stabilize.
- Crude oil prices increase slightly.
- Natural gas prices ease.
by:Tom Moeller
|in:Economy in Brief
 Europe| Jul 15 2025
EMU IP and Sectors Recover
Output jumped in the European Monetary Union in May. The main gain followed a 2.2% drop in April that was preceded by a 1.8% increase in March. There's been some turbulence in output over the last few months with April showing declines for all the major sector components.
Moving beyond monthly data, the sequential run of growth rates from 12-months to 6-months to 3-months shows that total industrial production is on an accelerating path from 3.8% over 12 months, to over 5% over six months as well as over three months. Manufacturing alone shows a 12-month 3.6% growth rate, rising to 4.7% over six months and to 5.8% over three months.
Sectors Sectors show a trend toward acceleration in consumer goods production where a 10.3% growth rate over 12 months progresses to 20.1% over six months and only backs off to 18.5% over three months. Splitting consumer goods output into durables and nondurables, we find less strength among durables with flat performance over 12 months, a 3.7% annual rate decline over six months, and a 4.3% annual rate increase over three months. However, for nondurables the growth rate surges from 11.6% over 12 months to 23.1% over six months and stays over 20% over three months. Intermediate goods’ trend is the fly in the ointment for industrial production, as output falls by 1.7% over 12 months, falls at a 2% pace over six months, and then falls at a 4.9% annual rate over three months. That setback is surprising given the growth rate and other categories. Capital goods show a strong accelerating phase from 4.1% over 12 months to a 5% growth rate over six months to 15.5% over three months.
Countries Looking across specific countries, the table shows 13 monetary union members in May - Seven of them show output contracting. That's the same number contracting as in April although in March only four showed industrial output contracting month to month.
The sequential growth rates calculated over broader periods show eight countries with output contracting over three months, but only five with output contracting over six months; six countries report lower output over 12 months – a much longer span of time.
Mixed trends within the community The sector data for all of the Monetary Union are relatively upbeat, but the country level data show a lot more mixed performance across individual country units; only Ireland, Finland, and Germany show output increases over three months, six months and 12 months. Conversely, Greece, France, and Belgium show output declines over three months, six months and 12 months.
The quarter-to-date (QTD), with two months of data in hand, is showing six countries with output declining on QTD-to-date basis. But for the EMU region as a whole, output is advancing at a 1.6% annual rate. Manufacturing output is rising at a stronger 1.9% annualized pace – with real strength in capital goods output.
Ranking performance The far right-hand column ranks current growth rates on data back to 2007. Seven of thirteen countries rank below 50% which is their median growth rate for the period. Finland, Ireland, and Portugal are quite strong; Malta and German have rankings solidly above their respective 50th percentiles. The Netherlands, Italy, France, and Austria have rankings in their 40th percentiles, lagging their median pace but in a 40% to 50% range. Belgium emerges as the weakest country on a ranking basis, standing only in its lower 8.7 percentile and it is riding a losing streak to boot.
Overall EMU IP rankings are solid-two sectors lag Overall EMU rankings show total output with a 66.1 (top one-third) percentile ranking with manufacturing at 59.6 percentile. Consumer nondurables are the strongest sector at a 98.2 percentile ranking. Both consumer durables and intermediate goods have lower standings: 40.8% for consumer durables and 37.6 percentile for intermediate goods. Both of those sectors are lagging and also carrying weak momentum. In contrast, capital good output is surging and its ranking at 47.7% is mostly below its median rank (at 50%).
Stimulus diverted? NATO has signed on for more miliary spending and this has been expected to underpin growth in Europe. But some of that stimulus will be redirected in just-announced deal in which the U.S. will manufacture arms and NATO would pay for them to help Ukraine. It is unclear how much stimulus that we had expected for Europe might be redirected to the U.S. by this new deal.

- Prices increase broadly after earlier declines.
- Metals price strength is accompanied by higher oil costs.
- Lumber prices surge but natural rubber prices decline.
by:Tom Moeller
|in:Economy in Brief
 Japan| Jul 14 2025
Japan’s IP Is Still Waffling and Weak
Japan's industrial production continues to be weak with output falling by 0.2% in May after falling by 1% in April and coming up lame - at flat - in March. Sequential growth rates are not telling an upbeat story either, with 12-month industrial production lower by 0.8%; over six months the decline is only 0.2% at an annual rate, but then over three months the annual rate of decline is 4.6%.
Manufacturing shows similar weakness to the trend for overall industry, but the three-month growth rate is at -5.7% at an annual rate.
Two key industries for Japan, textiles and transportation, show up with the declines over all three horizons. And for transportation, the decline over the last three months is 11.1% at an annual rate.
Manufacturing industries in Japan show a great deal of variation with consumer goods output on a more or less accelerating path, growing 3.2% over 12 months and then up to a 12% annual rate over three months. Intermediate goods output is in a significant decelerating phase, falling 3% over 12 months, falling at a 1.2% annual rate over six months and then stepping up the pace of decline to -6.6% at an annual rate over three months. Investment goods show a good deal more life, falling only 0.1% over 12 months, then growing at a 3.9% annual rate over six months and surging at a very vibrant 8.3% annual rate over three months.
Mining activity in Japan is recovering, showing a 6.8% annual rate decline over 12 months, a 5% annual rate decline over six months, and an 11% annual rate increase over three months.
Utilities output from gas and electric utilities shows a decline of 1% over 12 months, growth of 2.3% over six months. and then output declined at a 19.2% annual rate over the last three months.
- of10Go to 6 page