The Philadelphia Federal Reserve Bank indicated that as the third quarter began, the U.S. economy's forward momentum waned. The Bank's July index of regional factory sector activity fell for the second straight month to 5.1, the [...]
 Global| Jul 15 2010
Philadelphia Fed Index Suggests Further Economic Slowdown
by:Tom Moeller
|in:Economy in Brief
- Global| Jul 15 2010
U.S. Industrial Production Recovery Stutters
The recovery in industrial output ground to a halt last month. Overall production ticked up just 0.1 after a little-revised 1.3 May increase. But all of the latest increase was due to hot temperatures and higher utility output. In the [...]
by:Tom Moeller
|in:Economy in Brief
- Global| Jul 15 2010
U.S. Producer Prices Decline For Third Month, Again With Lower Food & Energy Costs
Pricing pressures at the wholesale level again diminished last month. A 0.5% decline in the June PPI was the third in a row that owed to consecutive declines in food & energy prices. The drop exceeded Consensus expectations for a 0.1% [...]
by:Tom Moeller
|in:Economy in Brief
- Global| Jul 14 2010
U.S. Retail Spending Declines Unexpectedly
Consumers began the summer season on a cautious note. Retail sales unexpectedly fell 0.5% last month. To emphasize the notion of lost momentum, May's decline was revised to 1.1% from 1.2% but the gain in April sales was halved to [...]
by:Tom Moeller
|in:Economy in Brief
- Global| Jul 14 2010
Euro-Area IP Continues Its Gains But Trends Slow
While Euro-Area IP made strong gains in May again and its three-month growth rate picked up, the Yr/Yr rate of growth is giving back ground. It looks as though Europe's rate of industrial production growth is set to slow. The three [...]
- Global| Jul 14 2010
U.S. Business Inventories Barely Increase
There has been a turn in inventory management, but it's been moderate. Business inventories ticked up 0.1% in May for the seventh increase in the last eight months. That was enough to lift inventories by a moderate 2.5% during the [...]
by:Tom Moeller
|in:Economy in Brief
- Global| Jul 14 2010
U.S. Import Prices Decline Across-the Board
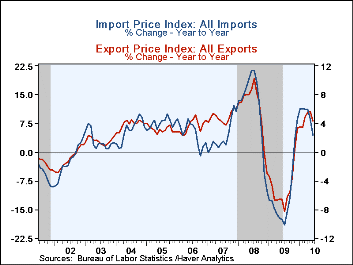
The upward pressure on import prices continues to diminish. U.S. import prices in June fell 1.3%, their second consecutive monthly decline and the largest since early-last year. Moreover, the y/y gain fell to its least since November. The decline exceeded Consensus expectations for a 0.3% drop. Petroleum prices fell 4.4% and repeated their May decline while excluding petroleum import prices fell by 0.5% and reversed the May increase.
Due to the recent declines, energy prices are roughly unchanged from December after last year's 78.6% increase from December-to-December. Last week, Brent crude oil prices rose to $77.20 per barrel versus $74.80 in June. Non-oil import prices reversed all of the May increase with a 0.5% decline, perhaps reflecting some softening in the economy's growth rate. As a result, prices are up just 0.9% since year-end. From December-to-December price fell 0.2% in 2009. (During the last ten years, there has been a negative 81% correlation between the nominal trade-weighted exchange value of the US dollar vs. major currencies and the y/y change in non-oil import prices.)
Food & beverage prices reversed their May increase with a 1.7% decline (+6.2 y/y). That compares to a 2.8% decline during 2009. Prices for nonauto consumer goods slipped 0.4% (-0.1% y/y) after a 0.3% decline last year. Appliance prices strengthened at a 2.7% rate after last year's modest increase. Furniture prices have fallen 4.5% while apparel prices ticked up at a 0.4% rate. Imported auto prices fell at a 1.7% rate YTD after a 0.1% dip last year. Capital goods slipped 1.3% YTD and excluding computers prices slipped 0.7% YTD following a 0.7% gain last year.
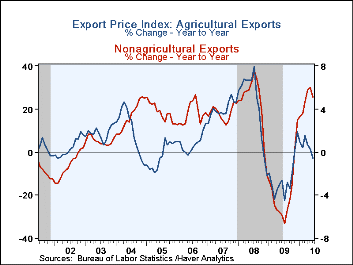
Total export prices slipped 0.2% increase last month after a 0.6% May gain. The decline reflected a 0.2% dip (5.9% YTD) in non-agricultural export prices and a 0.1% slip in agricultural goods prices (+0.2% YTD).
The import and export price series can be found in Haver's USECON database. Detailed figures are available in the USINT database.
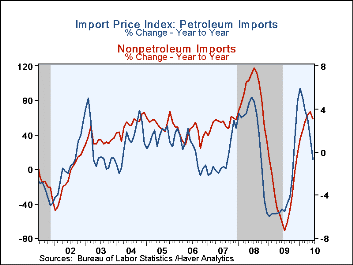
Import/Export Prices (NSA, %) June May April June Y/Y 2009 2008 2007 Import - All Commodities -1.3 -0.5 1.1 4.5 -11.5 11.5 4.2 Petroleum -4.4 -4.2 3.6 11.7 -35.9 37.7 11.6 Nonpetroleum -0.5 0.5 0.5 3.1 -4.1 5.3 2.7 Export - All Commodities -0.2 0.6 1.1 4.3 -4.6 6.0 4.9 by:Tom Moeller
|in:Economy in Brief
- Global| Jul 14 2010
U.S. Retail Spending Declines Unexpectedly
Consumers began the summer season on a cautious note. Retail sales unexpectedly fell 0.5% last month. To emphasize the notion of lost momentum, May's decline was revised to 1.1% from 1.2% but the gain in April sales was halved to [...]
by:Tom Moeller
|in:Economy in Brief


- of10Go to 6 page