

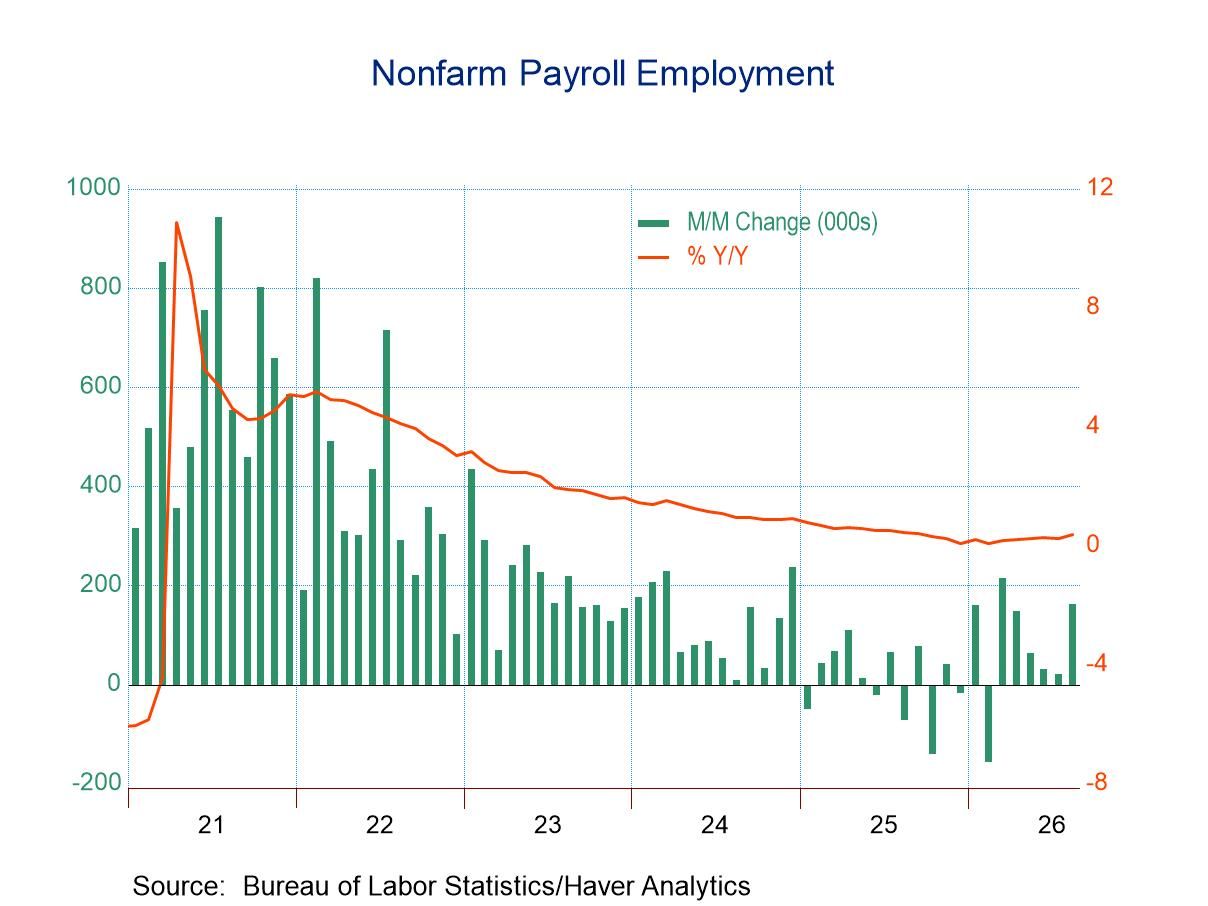
- U.S. nonfarm payrolls surged 162,000 in August with upward revisions to both June and July.
- The market consensus looked for a 52,000 increase.
- The unemployment rate was unchanged at 4.1%, the lowest rate since June 2025.
- In the household survey, employment jumped 569,000, its largest population-adjusted increase since November 2023.
- Average hourly earnings rose 0.3% m/m, but the y/y rate continued to trend down, sliding to 3.1%, the lowest since May 2021.
 USA| Sep 04 2026
U.S. Payroll Employment Surged in August
by:Sandy Batten
|in:Economy in Brief
 Global| Sep 03 2026
Charts of the Week: The Turn Towards Tightening
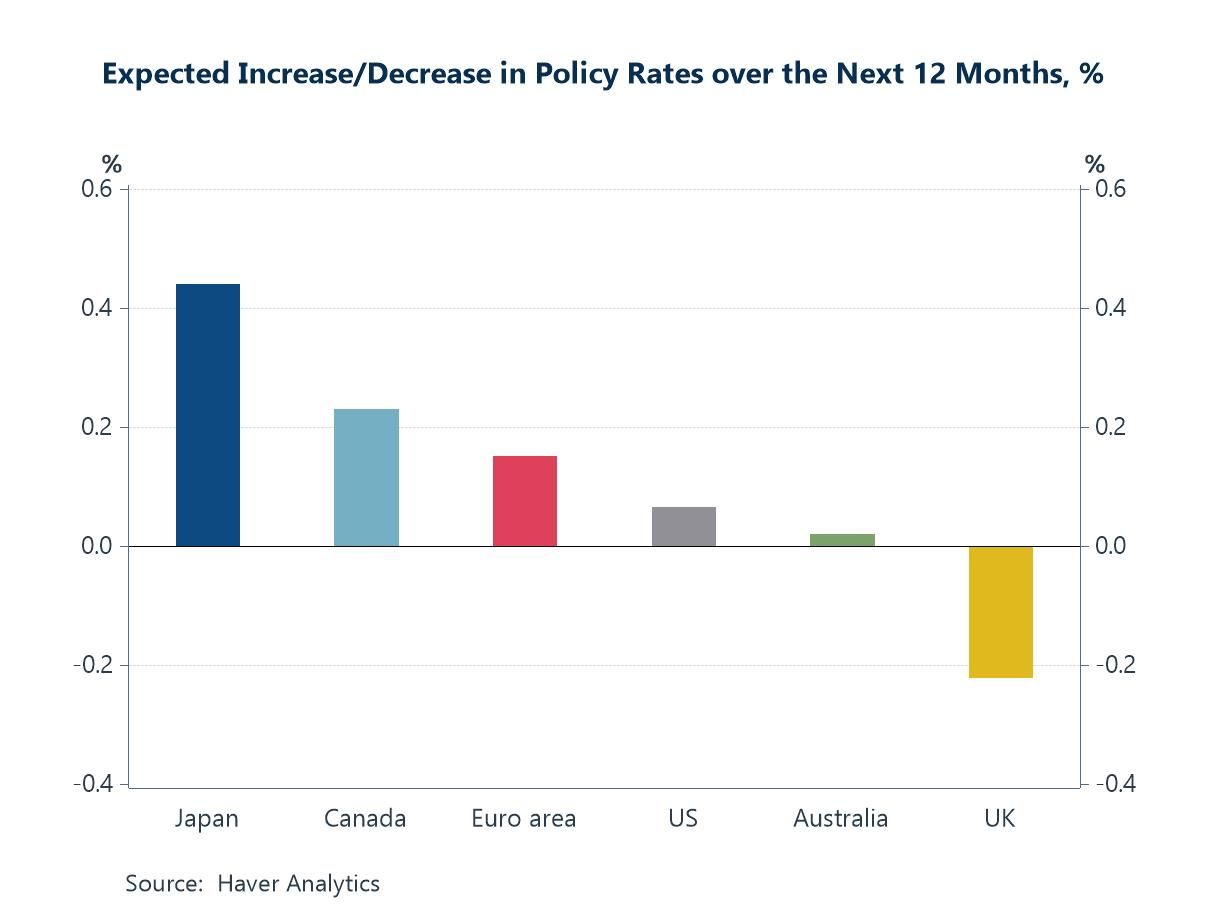
Central banks dominated the financial-market narrative last week. In his first Jackson Hole address as Federal Reserve chairman, Kevin Warsh indicated that the next move in US interest rates was more likely to be an increase than a cut. The ECB, having raised rates in June, is also expected to tighten further. Government bond yields consequently remained under upward pressure across the advanced economies, with long-term yields close to their highest levels in two decades. Rising real yields weighed on equities and gold, while oil climbed back above $90 following US strikes on Iranian launchers near the Strait of Hormuz. The latest Blue Chip Financial Forecasts survey places this shift in a broader context. Panellists expect policy rates to rise over the next twelve months in Japan, Canada and the euro area, with more modest increases anticipated in the United States and Australia; the United Kingdom is the only economy in which rates are expected to fall (chart 1). At the same time, shipping costs and global supply-chain pressures are rising again (chart 2), with renewed inflationary pressure emerging at the factory gate (chart 3). US labour demand is also shifting towards sectors where supply constraints appear most pronounced (chart 4). Yet core inflation across the G10 is now relatively close to target (chart 5). The final chart places these developments within a longer-term shift: after declining for four decades, the real cost of capital has moved decisively higher (chart 6).
by:Andrew Cates
|in:Economy in Brief
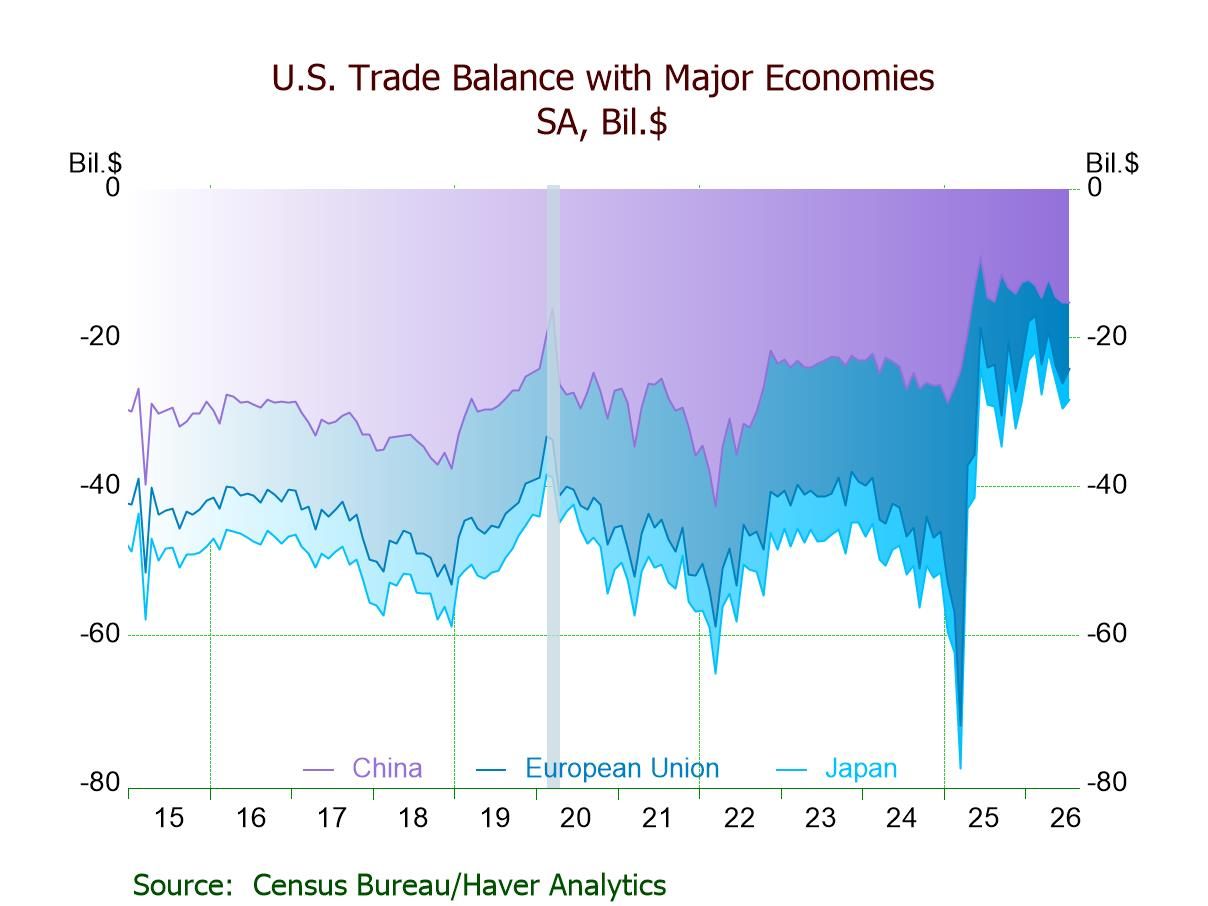
- Deficit: $88.6 bil. in July, up from $71.2 bil. in June, reflecting $119.6 bil. goods deficit & $31.0 bil. services surplus.
- Exports -2.1%, third straight m/m decline, driven by a plunge in nonmonetary gold exports.
- Imports +2.8%, fifth m/m increase in six months, boosted by a rise in capital goods imports.
- Real goods trade deficit widens to $106.4 bil., largest since Mar. ’25.
- Goods trade deficits w/ China down to a still-high $15.2 bil., w/ EU down to a 3-month low, and w/ Japan up to a 5-month high.
 USA| Sep 03 2026
Revised Productivity in Q2: No Adjustment to Moderate Growth
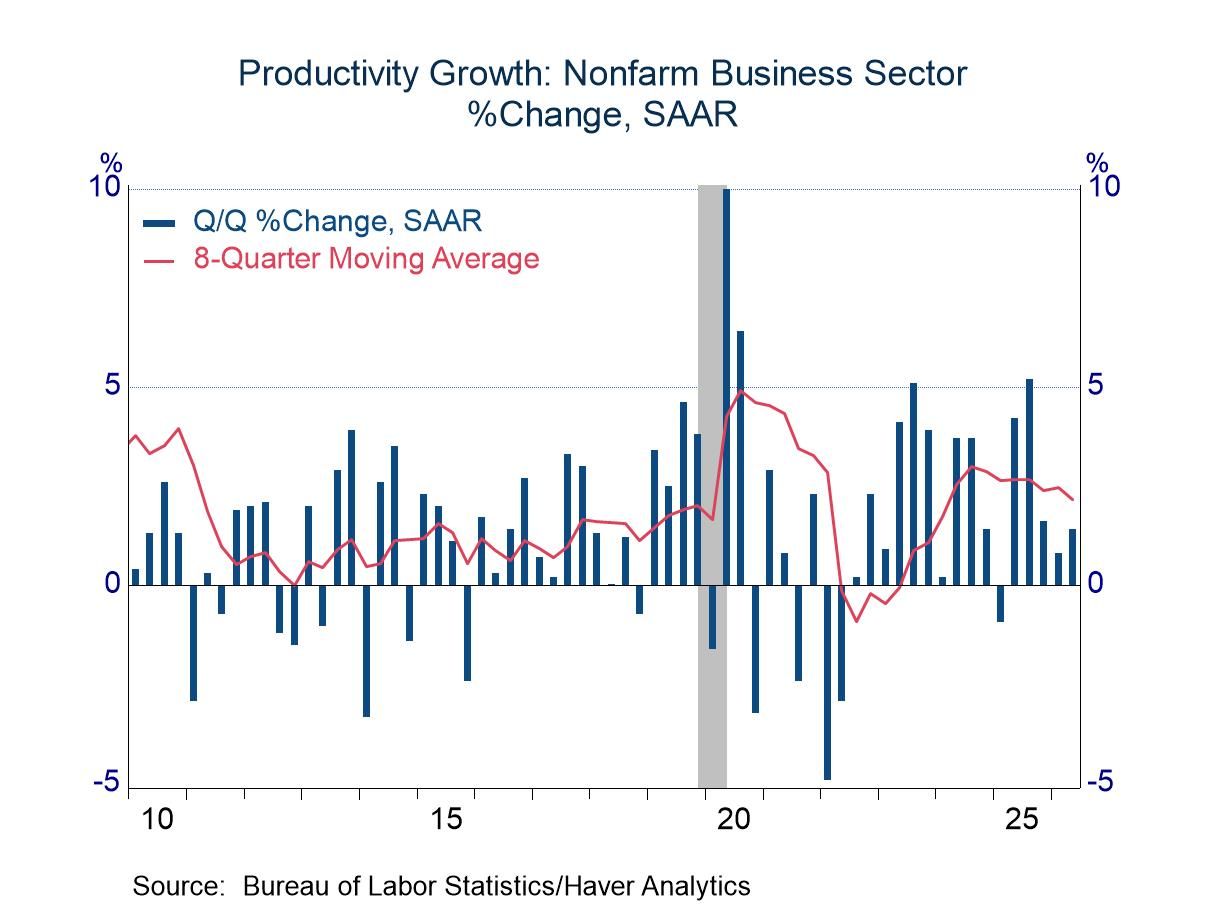
- Productivity gains, while still respectable, have lost a bit of vigor in recent quarters.
- The growth of unit labor costs eased slightly from an already moderate pace.
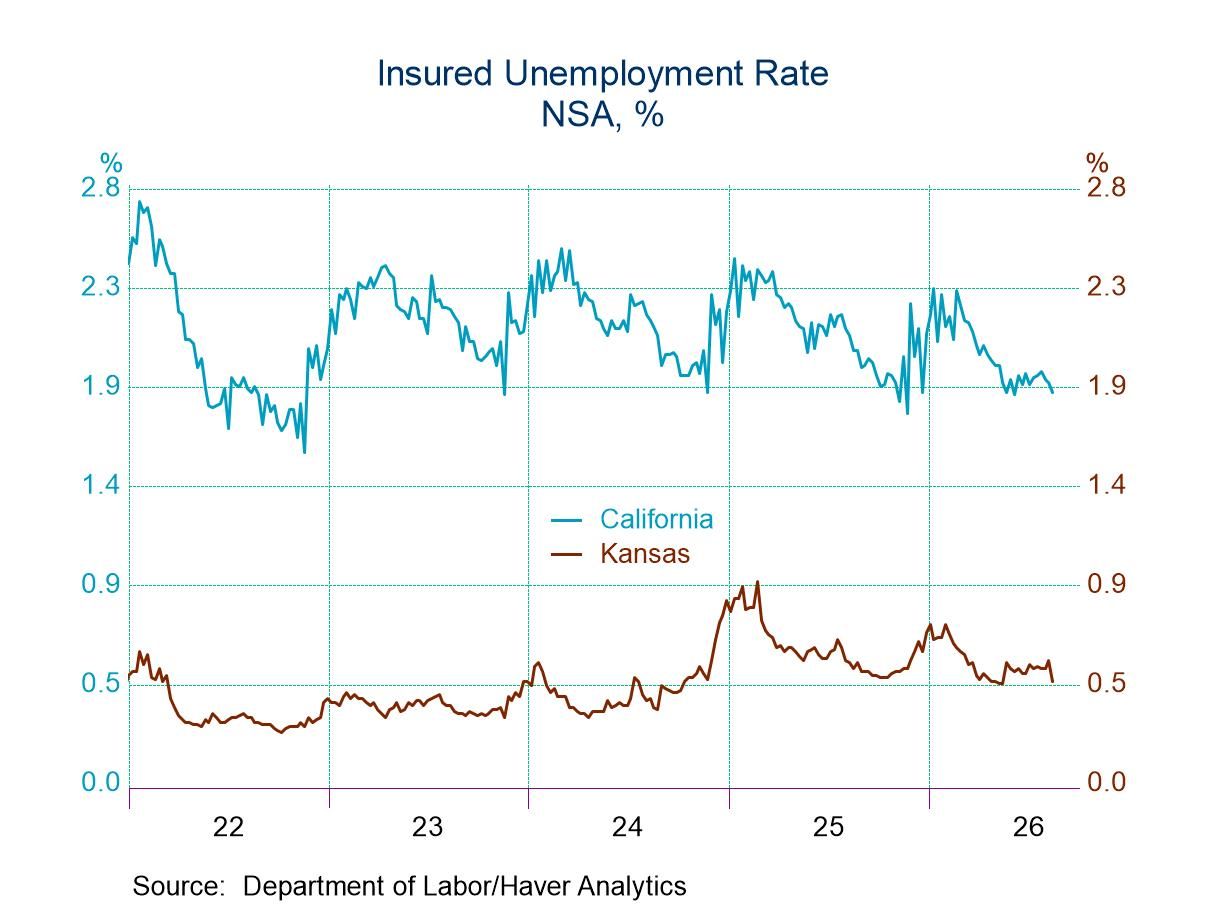
- New claims rose by 2,000 to 206,000 in the week of August 29.
- Continuing claims rose by 8,000 to 1.779 million in the week ending August 22.
- The insured unemployment rate was unchanged at 1.2% in the week of August 22.
 Global| Sep 03 2026
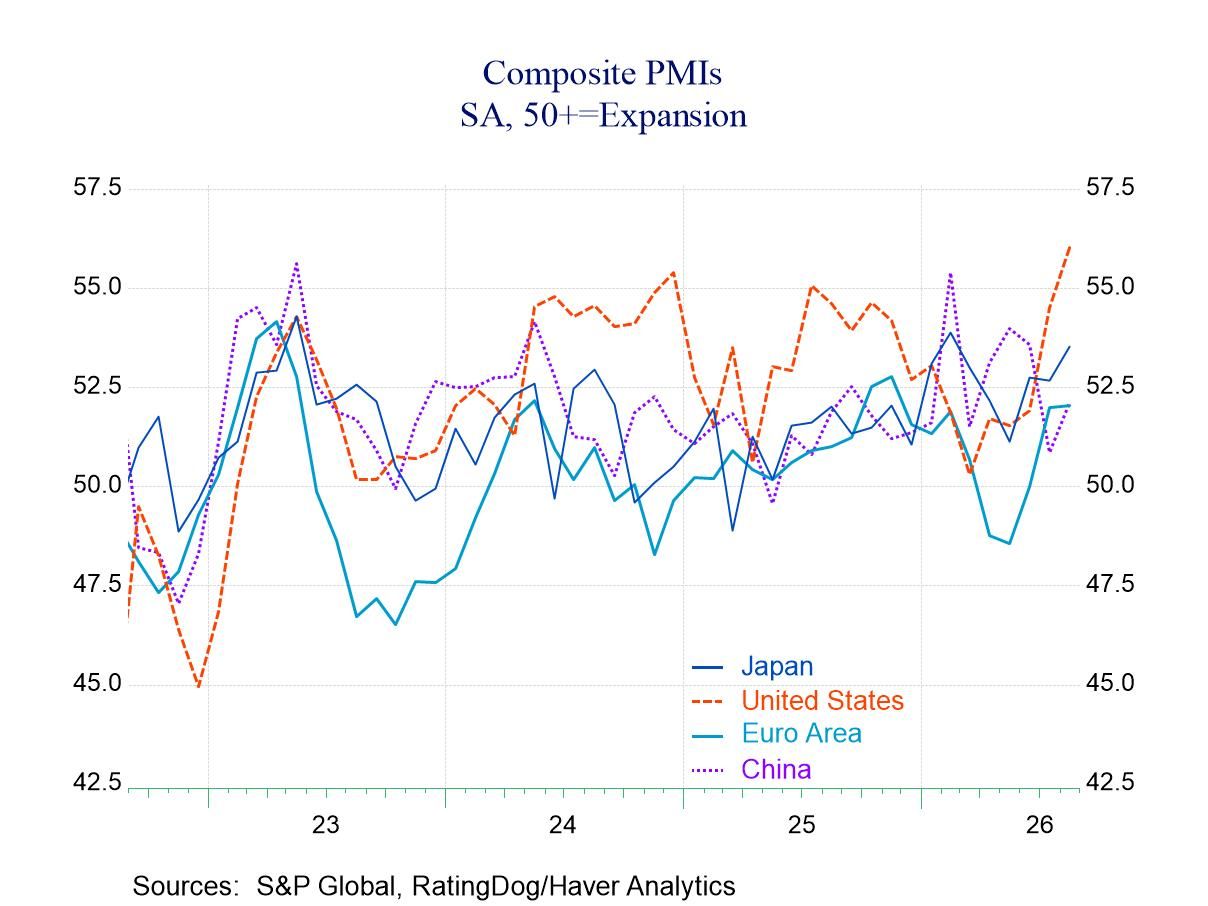
Total PMIs Show Slow Improvement in August
The total PMIs from S&P improved in August, with only eight of the reporting jurisdictions showing month-to-month backtracking. Only seven of the reporters in the table show readings below 50, indicating a contraction of output in the reporting country or unit.
The average and median readings for the full table show improvements, by and large, month to month in the total PMI readings. The sequential progression is more complicated, with a weakening in pace over six months and an improvement over three months compared to six months.
France, Ghana, Egypt, and Qatar show persistent levels of activity below a diffusion value of 50, indicating ongoing contraction over three months, six months, and 12 months, in addition to recent monthly readings that remain below 50 (except for Ghana in the latter case).
Nine of these 25 regions have percentile standings, depicted in the far right-hand column, below the 50% mark. These represent rankings of the August values among all observations back to January 2021. Readings below 50% indicate values below their respective medians on this timeline. So, 9 of 25 countries or reporting units as of August are showing readings that are below what they produced as a median over the previous approximately 4½ years. Among some of the larger countries, this includes France, the BRIC member Brazil, and Hong Kong, which has traditionally been a strong-performing unit when it was the British Crown Colony of Hong Kong.
Over three months, only five of the reporting areas have weakened compared to their averages over six months, and only seven of the reporting units show contraction over three months.
 USA| Sep 02 2026
U.S. Factory Orders Rebound More Than Expected in July on Strong Nondefense Aircraft Orders
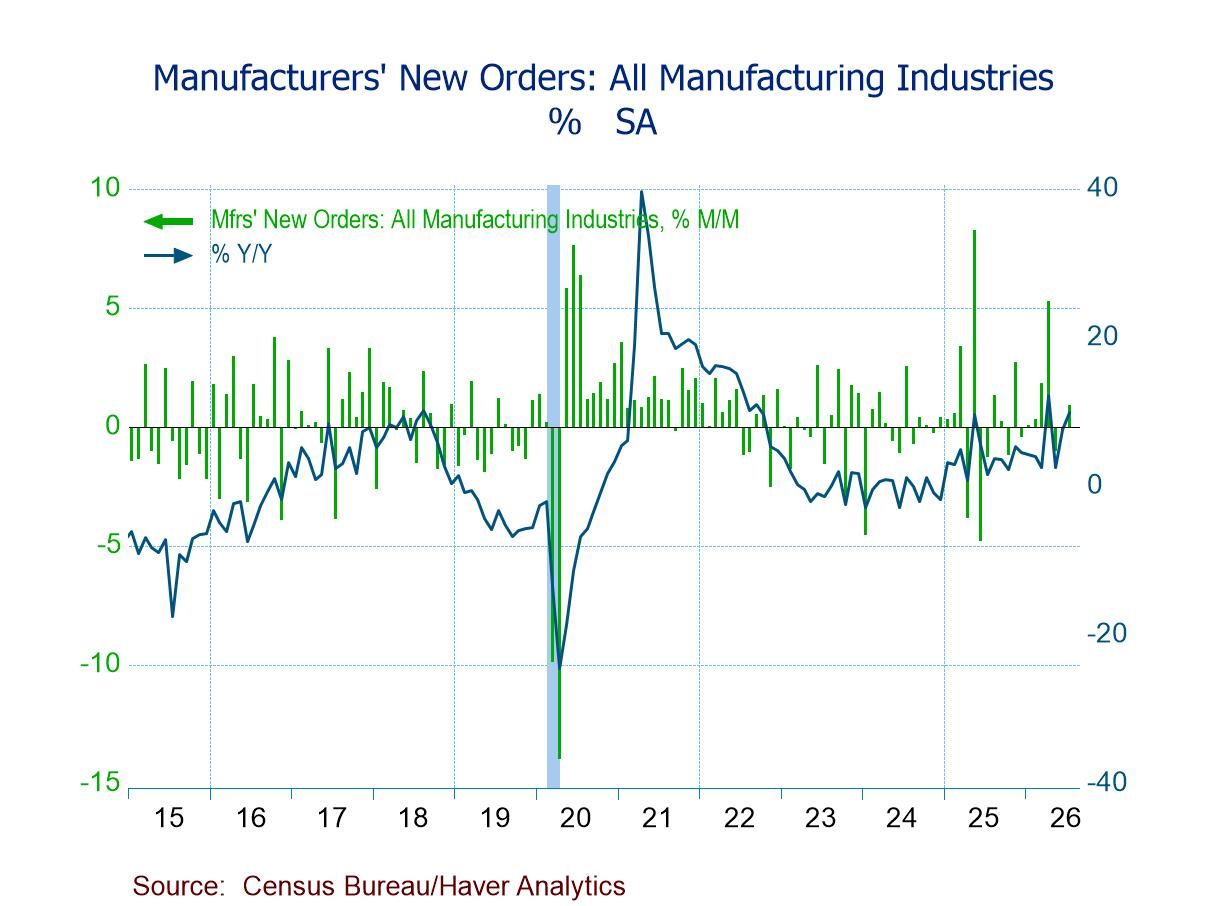
- Factory orders +0.9% (+9.9% y/y) in July, first m/m increase since Apr.; 15.2% above the Jan. ’24 low.
- Durable goods orders +1.1%, fourth m/m rise in five mths.; nondurable goods orders +0.7% and shipments +0.8%, seventh m/m gains in eight mths.
- Transportation orders +2.3%, led by a 12.7% jump in nondefense aircraft orders.
- Unfilled orders +0.6%, 12th straight m/m increase.
- Inventories +0.4%, ninth consecutive m/m rise.
 USA| Sep 02 2026
U.S. Mortgage Applications Rose in the August 28 Week
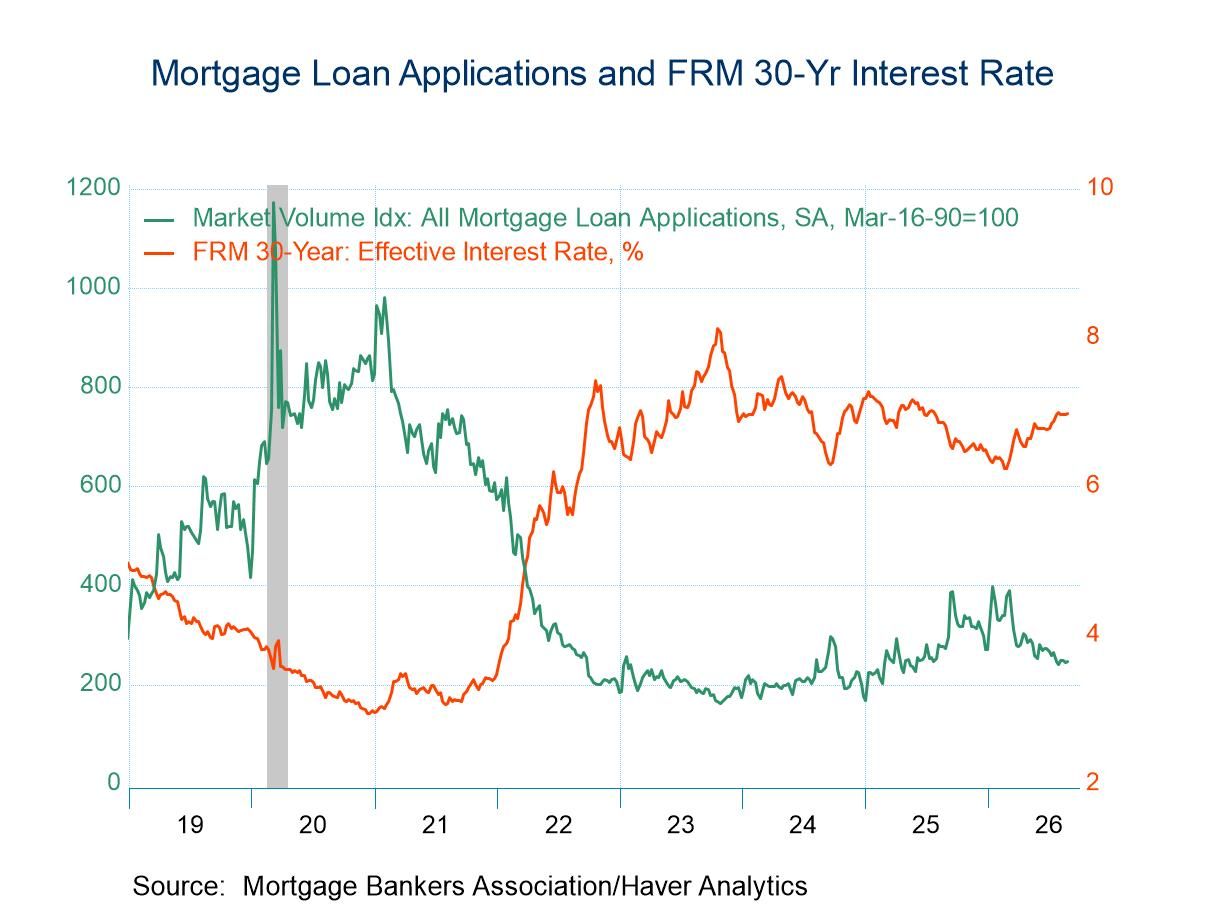
- Applications for loans to purchase rose and applications for loan refinancing declined in the latest week.
- Interest rate on 30-year fixed-rate loans edged up 1bp to 6.98%.
- Average loan size fell moderately in the August 28 week.
- of62Go to 5 page