There has been a turn in inventory management, but it's been moderate. Business inventories ticked up 0.1% in May for the seventh increase in the last eight months. That was enough to lift inventories by a moderate 2.5% during the [...]
 Global| Jul 14 2010
U.S. Business Inventories Barely Increase
by:Tom Moeller
|in:Economy in Brief
- Global| Jul 14 2010
U.S. Import Prices Decline Across-the Board
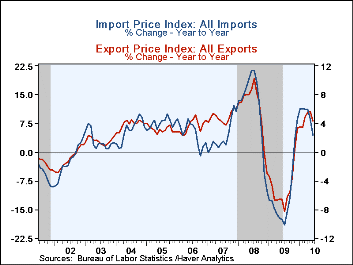
The upward pressure on import prices continues to diminish. U.S. import prices in June fell 1.3%, their second consecutive monthly decline and the largest since early-last year. Moreover, the y/y gain fell to its least since November. The decline exceeded Consensus expectations for a 0.3% drop. Petroleum prices fell 4.4% and repeated their May decline while excluding petroleum import prices fell by 0.5% and reversed the May increase.
Due to the recent declines, energy prices are roughly unchanged from December after last year's 78.6% increase from December-to-December. Last week, Brent crude oil prices rose to $77.20 per barrel versus $74.80 in June. Non-oil import prices reversed all of the May increase with a 0.5% decline, perhaps reflecting some softening in the economy's growth rate. As a result, prices are up just 0.9% since year-end. From December-to-December price fell 0.2% in 2009. (During the last ten years, there has been a negative 81% correlation between the nominal trade-weighted exchange value of the US dollar vs. major currencies and the y/y change in non-oil import prices.)
Food & beverage prices reversed their May increase with a 1.7% decline (+6.2 y/y). That compares to a 2.8% decline during 2009. Prices for nonauto consumer goods slipped 0.4% (-0.1% y/y) after a 0.3% decline last year. Appliance prices strengthened at a 2.7% rate after last year's modest increase. Furniture prices have fallen 4.5% while apparel prices ticked up at a 0.4% rate. Imported auto prices fell at a 1.7% rate YTD after a 0.1% dip last year. Capital goods slipped 1.3% YTD and excluding computers prices slipped 0.7% YTD following a 0.7% gain last year.
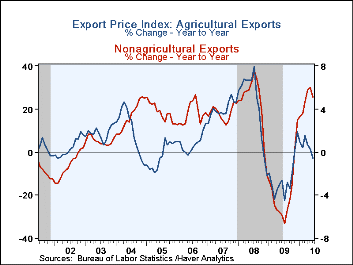
Total export prices slipped 0.2% increase last month after a 0.6% May gain. The decline reflected a 0.2% dip (5.9% YTD) in non-agricultural export prices and a 0.1% slip in agricultural goods prices (+0.2% YTD).
The import and export price series can be found in Haver's USECON database. Detailed figures are available in the USINT database.
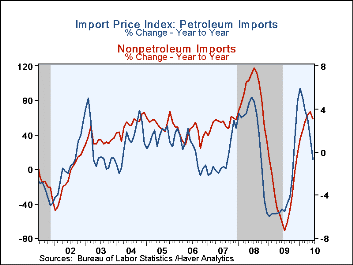
Import/Export Prices (NSA, %) June May April June Y/Y 2009 2008 2007 Import - All Commodities -1.3 -0.5 1.1 4.5 -11.5 11.5 4.2 Petroleum -4.4 -4.2 3.6 11.7 -35.9 37.7 11.6 Nonpetroleum -0.5 0.5 0.5 3.1 -4.1 5.3 2.7 Export - All Commodities -0.2 0.6 1.1 4.3 -4.6 6.0 4.9 by:Tom Moeller
|in:Economy in Brief
- Global| Jul 14 2010
U.S. Retail Spending Declines Unexpectedly
Consumers began the summer season on a cautious note. Retail sales unexpectedly fell 0.5% last month. To emphasize the notion of lost momentum, May's decline was revised to 1.1% from 1.2% but the gain in April sales was halved to [...]
by:Tom Moeller
|in:Economy in Brief
- Global| Jul 14 2010
U.S. Retail Spending Declines Unexpectedly
Consumers began the summer season on a cautious note. Retail sales unexpectedly fell 0.5% last month. To emphasize the notion of lost momentum, May's decline was revised to 1.1% from 1.2% but the gain in April sales was halved to 0.3%.
by:Tom Moeller
|in:Economy in Brief
- Global| Jul 14 2010
U.S. Retail Spending Declines Unexpectedly
align="left" /> Consumers began the summer season on a cautious note. Retail sales unexpectedly fell 0.5% last month. To emphasize the notion of lost momentum, May's decline was revised to 1.1% from 1.2% but the gain in April sales [...]
by:Tom Moeller
|in:Economy in Brief
- Global| Jul 13 2010
U.S. Trade Deficit Deepens Slightly Month over Month and Still Is Sharply Deeper Than Last Year
A stronger U.S. economy continued its effect of deepening the U.S. foreign trade deficit during May. The deficit of $42.3B followed an unrevised April figure of $40.3B. The latest figure was the deepest since December 2008 and [...]
by:Tom Moeller
|in:Economy in Brief
The Bureau of Labor Statistics reported that labor market conditions remained improved. The Job Openings & Labor Turnover Survey (JOLTS) indicated that the job openings rate during May slipped to 2.4% from 2.5% during April. [...]
by:Tom Moeller
|in:Economy in Brief


- of121Go to 54 page