 Global| Jul 14 2010
U.S. Retail Spending Declines Unexpectedly
by:Tom Moeller
|in:Economy in Brief
Summary
align="left" /> Consumers began the summer season on a cautious note. Retail sales unexpectedly fell 0.5% last month. To emphasize the notion of lost momentum, May's decline was revised to 1.1% from 1.2% but the gain in April sales [...]
 align="left" />
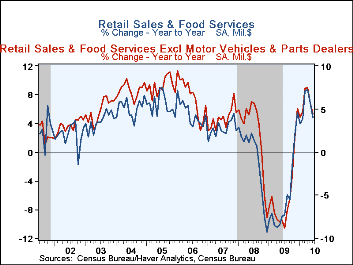
Consumers began the summer season on a cautious note.
Retail sales unexpectedly fell 0.5% last month. To emphasize the notion of lost
momentum, May's decline was revised to 1.1% from 1.2% but the gain in April
sales was halved to 0.3%. The drop in June sales
disappointed Consensus expectations for a 0.2% decline and for 2Q as a whole,
retail sales rose 4.1% (AR), half the 1Q increase and the weakest of the last
four quarters.
align="left" />
Consumers began the summer season on a cautious note.
Retail sales unexpectedly fell 0.5% last month. To emphasize the notion of lost
momentum, May's decline was revised to 1.1% from 1.2% but the gain in April
sales was halved to 0.3%. The drop in June sales
disappointed Consensus expectations for a 0.2% decline and for 2Q as a whole,
retail sales rose 4.1% (AR), half the 1Q increase and the weakest of the last
four quarters.
Much of the weakness in sales last month was due to a 2.3% decline in motor vehicles and parts purchases which owed to the 4.7% m/m decline in unit vehicle sales. Also, sales at gasoline service stations fell 2.0% (+8.8% y/y) as pump prices fell. The 0.1% slip in nonauto retail sales about matched Consensus expectations for a -0.0% reading. Excluding both auto and gasoline purchases, sales ticked 0.1% higher after a 1.0% May decline. For the quarter sales rose at a 3.8% annual rate, also half the 1Q gain and the weakest of the last three quarters. Last month's decline in retail sales again was paced by a 1.0% drop in sales at building materials & hardware stores which followed a 9.3% May shortfall.
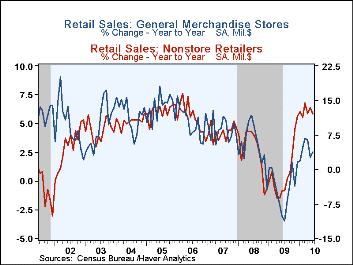
"Core" discretionary spending also remained soft last month. A 0.6% gain (5.7% y/y) in apparel store sales recouped May's decline but the 4.1% advance for the quarter was down from the 13.9% 1Q gain. General merchandise store sales ticked up 0.2% (2.6% y/y) last month but for the quarter sales declined at a 1.9% annual rate. Finally, sales of furniture, home furnishings & electronics rose 0.2% (4.6% y/y) during June but for the quarter fell at a 0.1% rate after an 11.4% 1Q gain. Furniture sales alone fell hard for the third straight month. The 1.1% decline (+1.7% y/y) was accompanied by a 1.3% increase (7.3% y/y) in sales of electronics & appliances. Sales by internet & catalogue vendors rose 1.0% (12.1% y/y) and May sales were revised sharply higher. Food service sales ticked 0.2% higher (2.8% y/y) after two months of slight decline.
The retail sales data are available in Haver's USECON database.

| June | May | April | June y/y | 2009 | 2008 | 2007 | |
|---|---|---|---|---|---|---|---|
| Total Retail Sales & Food Services (%) | -0.5 | -1.1 | 0.3 | 4.8 | -6.3 | -1.0 | 3.3 |
| Motor Vehicle & Parts | -2.3 | -0.6 | 0.5 | 6.8 | -12.0 | -13.9 | 0.8 |
| Retail Sales excluding Autos | -0.1 | -1.2 | 0.3 | 4.4 | -5.1 | 2.3 | 3.9 |
| Gasoline | -2.0 | -2.5 | 0.1 | 8.8 | -24.8 | 9.9 | 6.8 |
| Non-Auto Sales Less Gasoline | 0.1 | -1.0 | 0.3 | 3.9 | -1.9 | 1.2 | 3.5 |
U.S. Import Prices Decline Across-the Board
By Tom Moeller
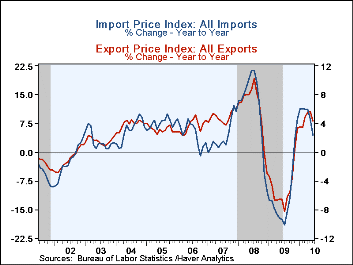 The upward pressure on import prices continues to diminish. U.S. import
prices in June fell 1.3%, their second consecutive monthly decline and the
largest since early-last year. Moreover, the y/y gain fell to its least since
November. The decline exceeded Consensus expectations for a 0.3% drop. Petroleum
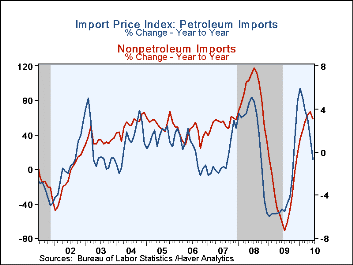
prices fell 4.4% and repeated their May decline while excluding petroleum import
prices fell by 0.5% and reversed the May increase.
The upward pressure on import prices continues to diminish. U.S. import
prices in June fell 1.3%, their second consecutive monthly decline and the
largest since early-last year. Moreover, the y/y gain fell to its least since
November. The decline exceeded Consensus expectations for a 0.3% drop. Petroleum
prices fell 4.4% and repeated their May decline while excluding petroleum import
prices fell by 0.5% and reversed the May increase.
Due to the recent declines, energy prices are roughly unchanged from December after last year's 78.6% increase from December-to-December. Last week, Brent crude oil prices rose to $77.20 per barrel versus $74.80 in June. Non-oil import prices reversed all of the May increase with a 0.5% decline, perhaps reflecting some softening in the economy's growth rate. As a result, prices are up just 0.9% since year-end. From December-to-December price fell 0.2% in 2009. (During the last ten years, there has been a negative 81% correlation between the nominal trade-weighted exchange value of the US dollar vs. major currencies and the y/y change in non-oil import prices.)
Food & beverage prices reversed their May increase with a 1.7% decline (+6.2 y/y). That compares to a 2.8% decline during 2009. Prices for nonauto consumer goods slipped 0.4% (-0.1% y/y) after a 0.3% decline last year. Appliance prices strengthened at a 2.7% rate after last year's modest increase. Furniture prices have fallen 4.5% while apparel prices ticked up at a 0.4% rate. Imported auto prices fell at a 1.7% rate YTD after a 0.1% dip last year. Capital goods slipped 1.3% YTD and excluding computers prices slipped 0.7% YTD following a 0.7% gain last year.
Total export prices slipped 0.2% increase last month after a 0.6% May gain. The decline reflected a 0.2% dip (5.9% YTD) in non-agricultural export prices and a 0.1% slip in agricultural goods prices (+0.2% YTD).
The import and export price series can be found in Haver's USECON database. Detailed figures are available in the USINT database.
| Import/Export Prices (NSA, %) | June | May | April | June Y/Y | 2009 | 2008 | 2007 |
|---|---|---|---|---|---|---|---|
| Import - All Commodities | -1.3 | -0.5 | 1.1 | 4.5 | -11.5 | 11.5 | 4.2 |
| Petroleum | -4.4 | -4.2 | 3.6 | 11.7 | -35.9 | 37.7 | 11.6 |
| Nonpetroleum | -0.5 | 0.5 | 0.5 | 3.1 | -4.1 | 5.3 | 2.7 |
| Export - All Commodities | -0.2 | 0.6 | 1.1 | 4.3 | -4.6 | 6.0 | 4.9 |
There has been a turn in inventory management, but it's been moderate. Business inventories ticked up 0.1% in May for the seventh increase in the last eight months. That was enough to lift inventories by a moderate 2.5% during the period after last year's 9.8% decline. Nevertheless, the increases have not kept up with the improvement in sales and the I/S ratio remained near its historic low at 1.24.
Retail inventories have started to rise and the 0.3% May gain was the sixth modest increase following sharp declines during 2008 & 2009. Nevertheless, the level of inventories remained 13.3% below the 2008 peak. Accumulation this year owes to modest gains in the auto sector (+2.4% YTD. Less autos, accumulation began only in March and it's been modest. Year-to-date inventories have risen 1.5% after last year's 4.9% decline and remain 6.5% below the 2008 peak. Recent accumulation has been notable amongst general merchandise and furniture stores while the decline in apparel store inventories abated
The business sales and inventory data are available in Haver's USECON database.
| Business Inventories (%) | May | April | March | May Y/Y | 2009 | 2008 | 2007 |
|---|---|---|---|---|---|---|---|
| Total | 0.1 | 0.4 | 0.7 | -1.5 | -9.8 | 0.8 | 4.0 |
| Retail | 0.3 | 0.2 | 0.9 | -1.8 | -10.4 | -3.3 | 2.5 |
| Retail excl. Auto | 0.3 | 0.5 | 1.1 | -0.3 | -4.9 | -1.9 | 2.7 |
| Wholesale | 0.5 | 0.2 | 0.7 | -2.1 | -10.5 | 3.7 | 6.4 |
| Manufacturing | -0.4 | 0.6 | 0.5 | -0.9 | -8.8 | -0.8 | 7.6 |

Tom Moeller
AuthorMore in Author Profile »Prior to joining Haver Analytics in 2000, Mr. Moeller worked as the Economist at Chancellor Capital Management from 1985 to 1999. There, he developed comprehensive economic forecasts and interpreted economic data for equity and fixed income portfolio managers. Also at Chancellor, Mr. Moeller worked as an equity analyst and was responsible for researching and rating companies in the economically sensitive automobile and housing industries for investment in Chancellor’s equity portfolio. Prior to joining Chancellor, Mr. Moeller was an Economist at Citibank from 1979 to 1984. He also analyzed pricing behavior in the metals industry for the Council on Wage and Price Stability in Washington, D.C. In 1999, Mr. Moeller received the award for most accurate forecast from the Forecasters' Club of New York. From 1990 to 1992 he was President of the New York Association for Business Economists. Mr. Moeller earned an M.B.A. in Finance from Fordham University, where he graduated in 1987. He holds a Bachelor of Arts in Economics from George Washington University.
More Economy in Brief


