- Survey turns positive for first time in six months.
- Production, employment & hours-worked readings improve.
- Prices and wages & benefits indicators weaken.
by:Tom Moeller
|in:Economy in Brief
 United Kingdom| Jul 28 2025
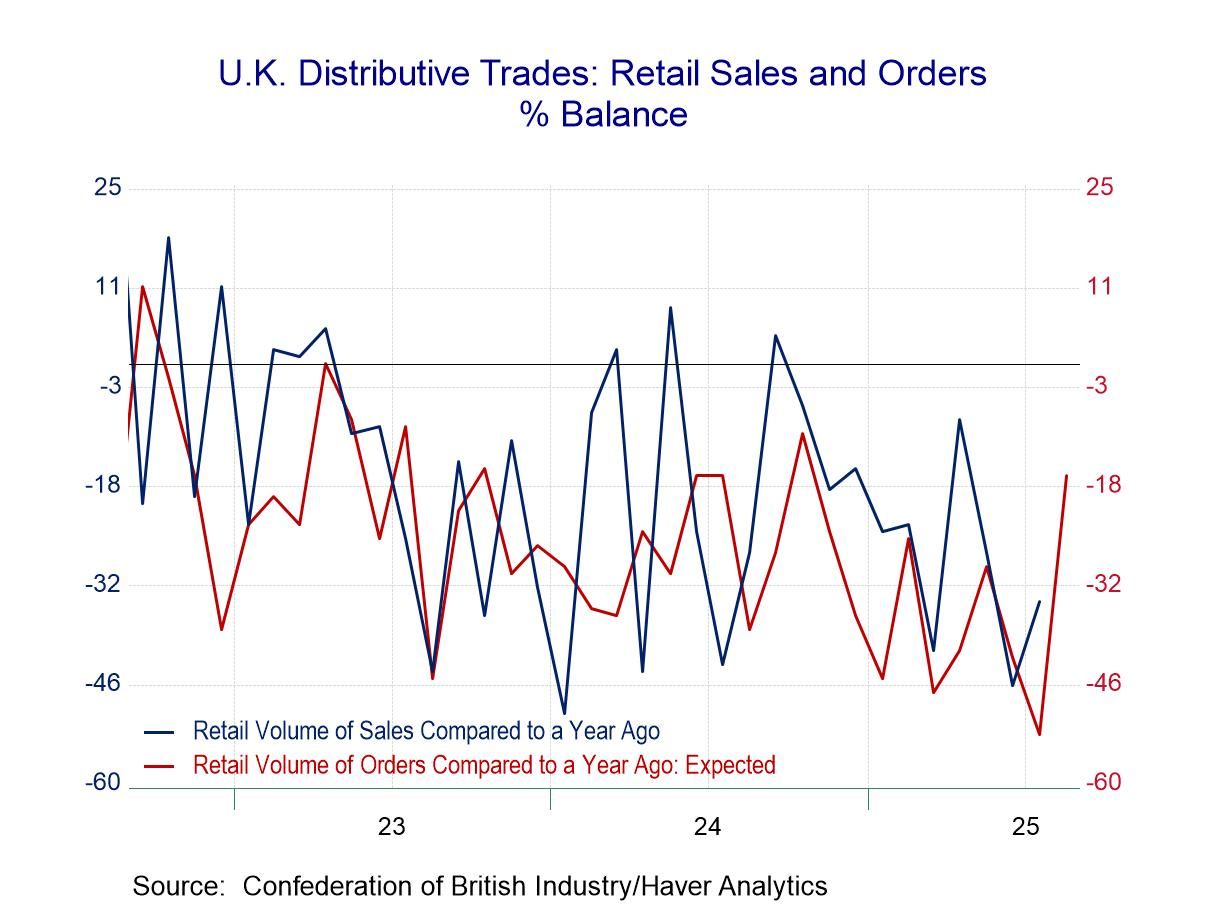
U.K. CBI Distributive Trades Survey: Still Very Weak - Depressing
The severe lethargy in U.K. retail and wholesale sales continues into July with the outlook portion of the survey for August still exceptionally weak.
Distributive sales retail volumes Sales in July: In July, the distributive trades volume survey finds sales for a year ago with 34% of the respondents indicating weaker sales compared to those indicating stronger sales. This net reading of -34 is a slight improvement from June’s -46 and signals deterioration compared to May (-27) as well. However, beyond the monthly bumping up and down, the ranking of this net reading is in the lower 8.5 percentile marking it as truly an exceptionally weak reading. The reading for orders compared to a year ago shows better comparisons but still a great deal of weakness and a net reading of -21, compared to -51 in June and -41 in May. It marks a 20th percentile standing, which is better than for sales compared to a year ago but still exceptionally weak. The next reading that, essentially is seasonally adjusted, comparing sales for the same time of year, shows a -10 reading which is better than -37 in June and better than May’s reading of -19 and steps up to a percentile standing at its 42nd percentile. It is still short of its median (which occurs at a ranking of 50%) but is a reading that looks a little closer to the land of the living than the land of the dead.
Expected sales in August: The distributive volumes statistics for sales expected for August, looking a month ahead, shows negative readings across the board for these same 3 metrics with all three of them improving in August from their July expectations; however, sales compared to a year ago have a 7-percentile standing, even weaker than their current July reading, orders have a 23.5 percentile standing, and sales for the time of year fare much worse with a 6.7 percentile reading - much worse than the current performance ranked for July. In short, there's very little in this survey that is encouraging or reassuring. Conditions are weak and even where there is improvement the new reading is still very weak and the expectations readings, while somewhat improved, are still extremely weak.
Distributive sales wholesale volumes Sales in July: The distributive trades survey for wholesaling produces another set of weak readings that are, for the most part, weaker in July than they were in June and, while different, not much better, or worse than they were in May. The percentile standings for wholesaling show sales compared to a year ago at a 7.4 percentile standing, orders compared to a year ago at a 3.2 percentile standing, and sales for the time of year at a 1.8 percentile standing. All of these are simply exceptionally weak.
Expected sales volumes in wholesaling: Turning to the expected sales for August once again, all the readings are net negatives; two out of three of them show some improvement compared to their July values; however, the rankings remained exceptionally weak. Sales compared to a year ago are at a 9.1 percentile standing, orders compared to a year ago are at a 5.3 percentile standing, and sales for the time of year are at a 2.1 percentile standing. The results for expected sales and orders in the wholesaling survey are extremely grim.
 Asia| Jul 28 2025
Economic Letter from Asia: Dealing with it
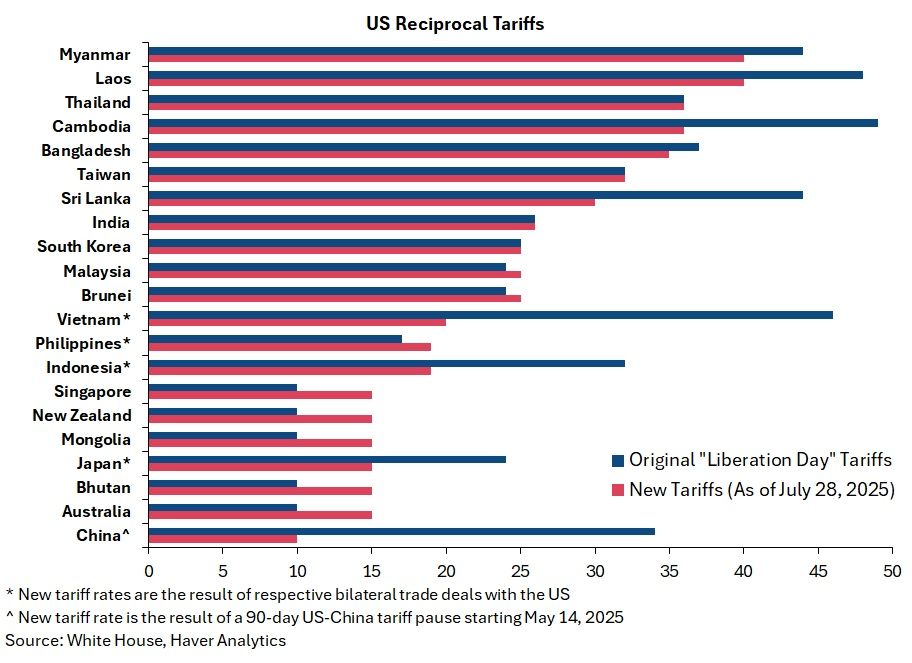
This week, we examine a series of major US trade and tariff developments since early July. The US has expanded its network of bilateral trade deals, including deals with Indonesia and the Philippines, both securing tariff rates of 19%. Meanwhile, former President Trump has seemingly raised the general tariff floor from 10% to 15%, potentially affecting countries like Australia, New Zealand, and Singapore (see chart 1). India, once expected to be among the first to reach a deal, has yet to finalize an agreement ahead of the August 1 deadline. Attention remains on China’s suspected use of transshipments through third countries to circumvent tariffs. One possible, though inconclusive, indicator is the decline in China’s direct exports to the US alongside stable overall export levels—suggesting either the use of transshipment routes or a broader redirection of exports to other markets (see chart 2).
Japan also recently struck a significant deal with the US, reducing its reciprocal tariff from 24% to 15%. This announcement boosted Japanese equities and the yen (see chart 3). However, Japan’s auto exports to the US continue to decline, with firms absorbing tariff-related costs to maintain competitiveness (see chart 4). Despite political uncertainty following the ruling LDP’s losses in recent upper house elections, Japanese markets have remained resilient (see chart 5). As the Bank of Japan prepares to announce its next rate decision, real wages have posted their sharpest decline in two years, while household spending—driven by car purchases—has surged (see chart 6).
Latest US tariff developments Several significant US trade developments have occurred since early July. Notably, the number of bilateral trade deals secured by the US has increased. For instance, Indonesia reached an agreement that reduced tariffs from 32% to 19%, while the Philippines avoided a previously threatened 20% rate, settling instead at 19%. Meanwhile, former President Trump has reportedly raised the tariff floor from 10% to 15%. This suggests that countries previously facing the 10% rate—such as Australia, New Zealand, and Singapore (which runs a trade surplus with the US)—will now be subject to higher duties, as illustrated in chart 1. In contrast, India, once expected to be among the first to reach a deal, has yet to produce a substantive agreement as the August 1 deadline approaches.
- Orders excluding transportation weaken.
- Shipments strengthen.
- Unfilled orders surge, led by aircraft; inventories increase slightly.
by:Tom Moeller
|in:Economy in Brief
 Global| Jul 25 2025
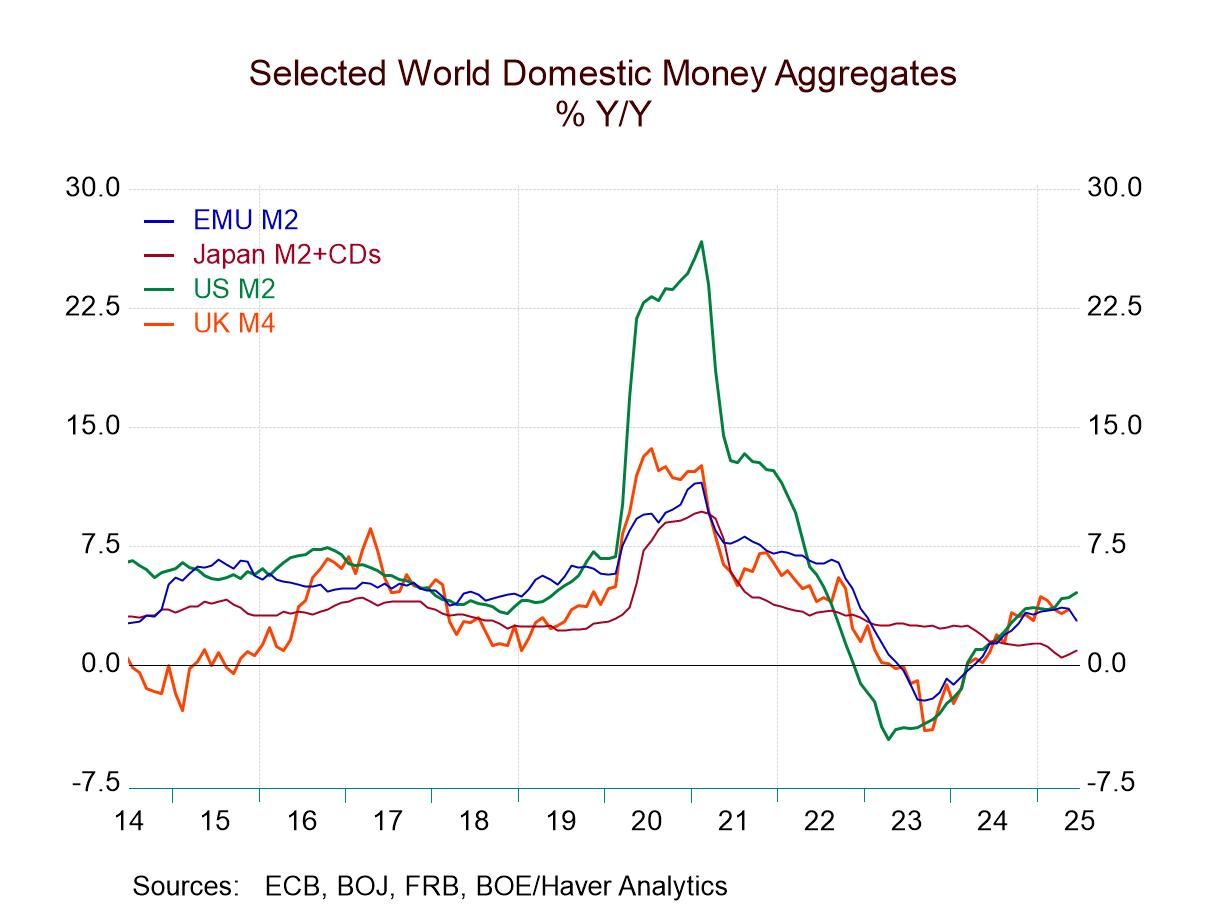
Global Money Supply Begins to Show Divergences; Watch the Green Line and Don’t Get Sleepy
Hypnotists are just trying to get you to focus on something and concentrate on it so that you can relax and they can put you into a hypnotic trance. Right now, you want to make sure that does not happen as you watch what is going on with money supply. It is not ‘entrancing’ and ought to be followed. The chart shows you that trends - and often excesses in ‘global money supply’ growth have begun in that money center country, the United States of America. And… well… here we go again? While it's very early in the game, it looks like, after a period of monetary weakness and re-escalation, U.S. money growth is now beginning to step up in the U.S. Meanwhile, in Europe and in the United Kingdom, money growth, especially real money growth, is beginning to tail off. All this is at a time when Japan's money growth, of course, has been marching to the step of a different drummer showing regular, consistent, nominal weakness and actual declines in the real money stock to try to tame its incipient inflation.
The Policy Zone We are no longer in the COVID era; or even in the post-COVID era. We are now in the post post-COVID era. And monetary policy is being made based on conditions rather than remedy perceived legacy problems in the economy from COVID. We need to make that transition in our analysis too, and ask ourselves, “What's really happening?” In the U.S., the popular dogma is to claim that central bank independence is being undercut and that Donald Trump's tariffs are going to raise the inflation rate and that the Fed is losing its battle with inflation and inflation is coming because of excessive fiscal policy and the imposition of tariffs. It's a story you can believe if you want to. There's certainly some evidence to support those points; whether they completely justify that point of view, it is still too early to say. However, clearly, money supply growth in the U.S. is ramping up. The U.S. 12-month growth rate is up to 4.5%, over six months the annualized rate hits 5.5%, and over three months the annualized rate hits 6.9%. It's hard to say that that's occurring because of Trump's tariffs. At the same time, the growth rate in real money balances - that's money supply deflated by the CPI - has boosted its growth rate from 1.8% over 12 months to a 2.9% annual rate over six months to a 4.4% annual rate over three months. Is the chase on for an inflation ‘uptick’ that will not be temporary?
Follow the leader, or go your own way? It will take some time to tell if the other money center countries are going to follow the leader or not. So far it looks like ‘or not.’ Money supply growth in the European Monetary Union (EMU) is actually decelerating slightly from 2.8% over 12 months to a 1.7% pace over six months to a 1.3% pace over three months. Similarly, in the EMU the growth of real balances has slipped from 0.8% over 12 months to a 0.2% annual rate over six months to a -0.6% annual rate (contraction) over three months. So far, euro area money supply is not tagging along with the U.S. trend.
Euro-credit trends Meanwhile, private credit growth in Europe has stabilized with the 12-month growth rate of 2.3% that moves up to 2.4% over six months and settles back to 2% over three months, a relatively stable performance that would seem to signal ongoing moderate growth. The growth rate of private credit, deflated for the effects of inflation, shows continued growth, and beyond that the trend is unclear. Over 12 months the growth rate is 0.3%, over six months that improves to 0.8%, and over three months it drops back to a 0.1% pace. I'm not good enough at splitting hair to be able to tell you what that trend is.
U.K. money weakens In the U.K., nominal money supply growth seems to be slowing, but that isn't crystal clear, with the 3.5% annual rate over 12 months moving up to a 4.1% annual rate over six months been slipping back to 1.7% over three months. It may take a few months to be able to tell if the step down to 1.7% is real or just volatility averaging out the step up over six months. U.K. money growth does not appear to be excessive or rogue; when we look at real balances, 12-month growth is -0.4%, six-month growth is -0.1% and the three-month growth rate is -1.6%. On that profile, real money growth in the U.K. does not appear to be following the U.S. rule book either.
Japan- dealing with its own complex issues We know that Japan has been off on its own for a while. Japan clearly has been fighting off a bout of inflation. But, since that development is relatively new, and the previous battle with deflation was relatively long-lived, if we think in terms of inflation averaging, Japan is still dealing with an extremely small problem. Despite the appearance of some real inflation (depending on the price index you look at to establish Japanese inflation trends), Japan's inflation overshoot in contexts is only making up for lost time.
Money growth in Japan is 0.9% over 12 months; however, it's only running at a 0.1% annualized over six months and over three months. The growth of real money balances in Japan is negative. Real balance growth rates are negative on balance over three years and two years; the 12-month growth rate for real money balances is -2.3%, over six months it is -2.2%, and over three months it is -2%. The degree of restriction has faded but faded only very marginally. The main point is that in Japan, real money balances are contracting and so there is a fight to reduce inflation going on behind the scenes and that's clearing up; you can see it in the money growth rates on the chart as well if not from the level or real interest rates. Japan is balancing complex needs.
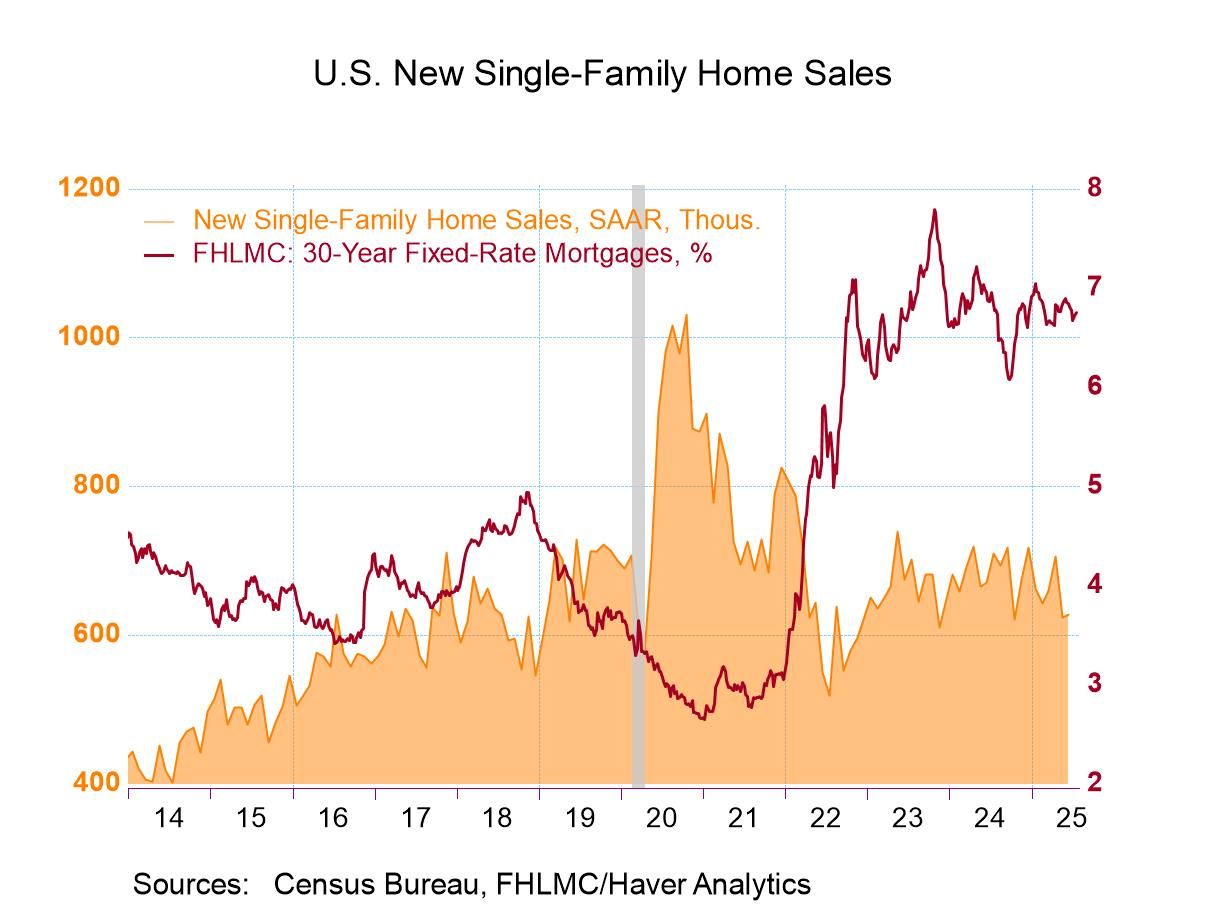
- Small gain in sales follows sharp decline.
- Sales are mixed throughout the country.
- Median sales price is lowest since November.
by:Tom Moeller
|in:Economy in Brief
 USA| Jul 24 2025
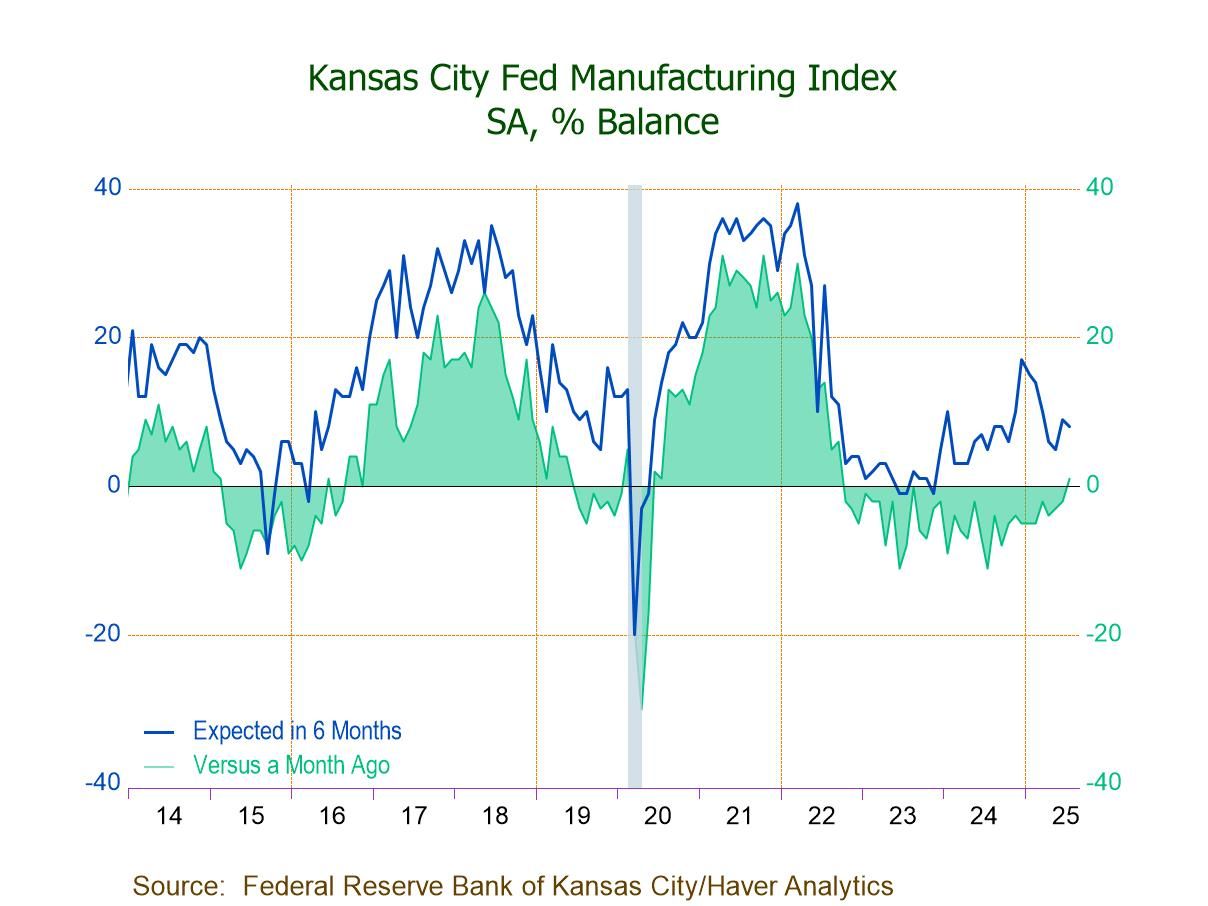
Kansas City Fed Manufacturing Index Rises in July; First Positive Reading Since Sept. ’22
- July Composite Index at 1 reflects positive numbers in materials inventories (8) and new orders (2), while employment (-11) and production (-3) post negative readings.
- Price growth cools somewhat, w/ prices paid down 4 pts. to 47 and prices received down 3 pts. to 18.
- Expectations for future activity, while edging down to 8, remain in positive territory.
 USA| Jul 24 2025
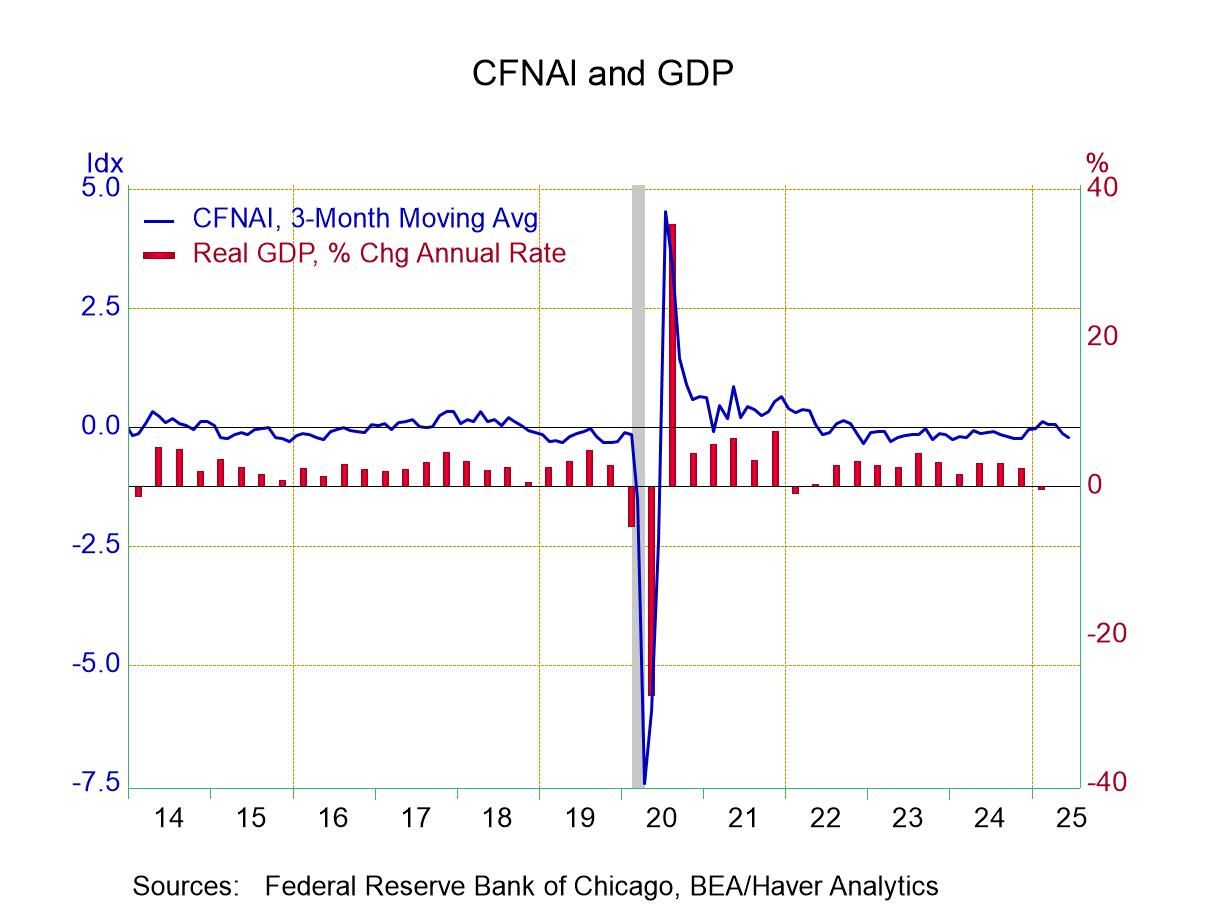
Chicago Fed’s National Activity Index Remains Negative in June
- Latest reading improves versus May.
- Each of four components are negative.
- Three-month trend weakens.
by:Tom Moeller
|in:Economy in Brief
- of10Go to 3 page