Haver Analytics
Haver Analytics

Economy in Brief: October 2026

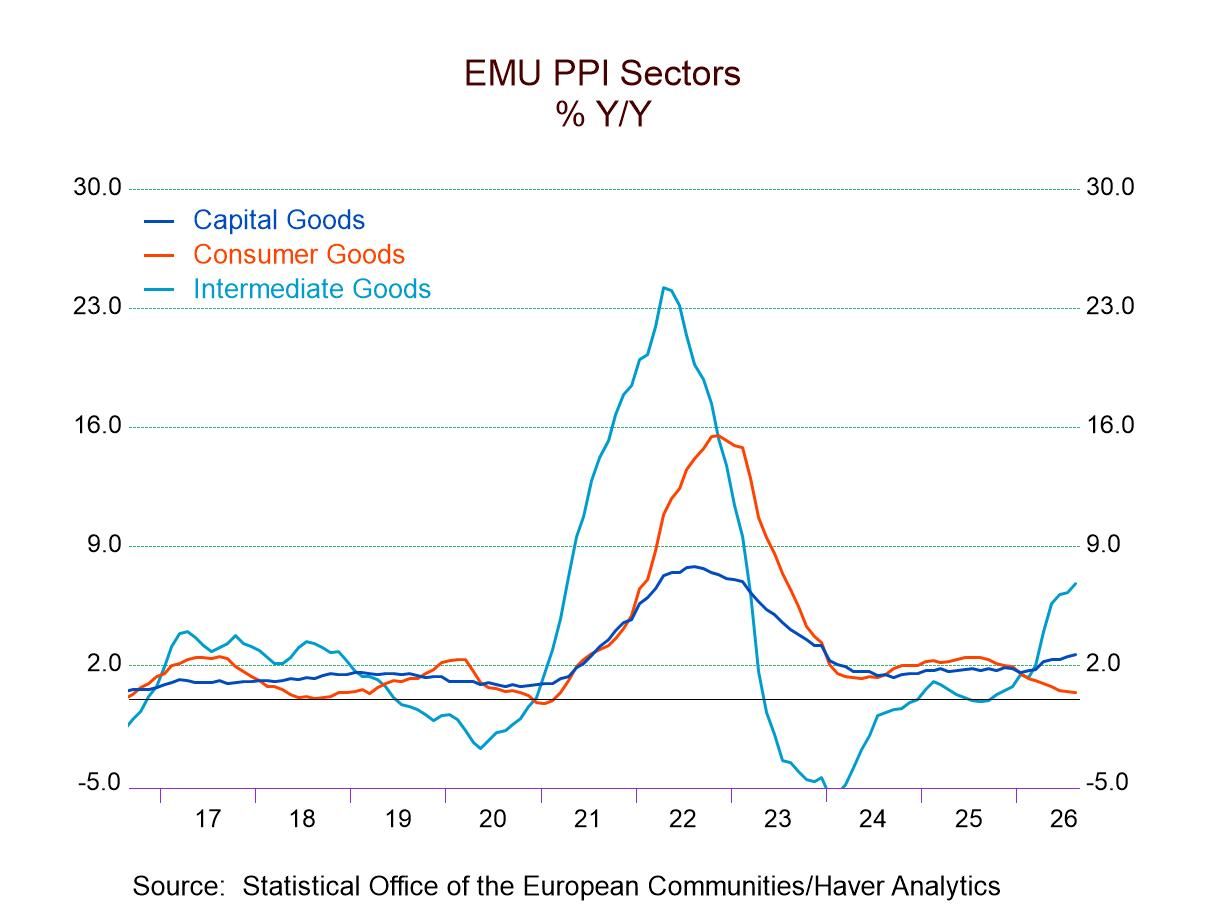
  • Think of this as though it's mixed doubles in tennis. This is a chart of the PPI pressures in the monetary union, while the table is a more detailed decomposition of pressures within the HICP consumer price measure. The PPI report is a graphic depiction of where the pressures are coming from in the inflation process at the primary levels. It shows us that the greatest pressures are coming from intermediate goods, where the kick to inflation is the strongest. Next, capital goods prices at the producer level are rising on a milder gradient, enjoying an increase at a pace above 2%. However, consumer goods prices in the PPI framework are weak, with a growth rate that has migrated back down toward zero. Yet in the overall HICP data, consumer prices at the consumer level are showing considerable pressure. They're also showing considerable upward momentum, and they're showing us broad inflation pressures all on their own.

    The pressures we see in consumer prices are not being pushed up through the producer-price process per se. However, depending on how you look at or think about consumer prices, we know that PPI prices are part of the cost of consumer goods and transportation costs are actually part of the cost of selling to the public as well. That requires not just the production of consumer goods but also the transportation of them to the wholesale location and then to the retail location. Transportation costs are an important part of consumer prices, and we're more aware of that these days because people do a lot more online shopping. They can see the difference between going to the store for a good and having it delivered to their house, where they have to pay an explicit delivery charge. A delivery charge would reflect the fact that somebody has to come to deliver it, but also that a vehicle has to be driven and that vehicle has to be fueled. The PPI shows us that a lot of the pressure being passed on is coming through that fuel channel.

    Despite the fact that there's not a lot of cost-push pressure coming from the producer-price stage of production to the consumer, that certainly does not mean that final product consumer price pressures don't exist. We see those pressures in the detailed consumer price report exhibited in the table. As of September, the HICP headline was up 3.8% over 12 months, with the core at 2.5%. Both of those ring the cash register at a pace too high for the ECB target. As of September, that 3.8% pace is at a 90.8 percentile standing on year-over-year inflation data back to 2001, a 25-year comparison. But the lower 2.5% core pace still has an 85.6 percentile standing on that same timeline. These metrics tell us that not only is inflation too high by the standards of the European Central Bank, but they are also significantly elevated compared to what they've been historically.

    We provide year-over-year inflation rates for detailed categories within the HICP as well as in the right-hand column, the rankings of inflation for those different categories. Inflation clocks a pace above the 50% ranking for nine of the categories in the HICP presented in the table. In contrast, only five categories have rankings below 50%. The 50% level is significant for rankings because it identifies the median for each of these measures, so we have above-median inflation in nine categories and below-median inflation in only five.

    At the bottom of the table, we look at the percent of categories for which inflation is accelerating over three months and over six months. Over three months, inflation is accelerating for 56% of the categories, whereas over six months inflation is accelerating in 50% of the categories. Acceleration tendencies are neutral; by this, I mean that, in data back to 2001, the average percent accelerating over three months is 50% and the average accelerating over six months is 50.2%, so that inflation accelerating or decelerating over this broad period has been an even-handed proposition, with inflation accelerating about half the time and decelerating about half the time. That's just a statement about the proportion of categories that are accelerating; the next question is how strong the acceleration is, because the ranking at the far-right hand side of the table shows that, for three-month inflation, the ranking for the proportion of categories that are accelerating is at 53.9%, whereas over six months, the ranking is at 53.7%. The table also shows the median inflation for the categories listed in the table as well as the average. In September, the median category saw inflation at 2.7%, while the average category was at 2.9%. The median rank of inflation on data back to 2001 is at 63.6%, while the average rank of inflation back to 2001 is 59.9%. There was a slight step down in the median and average inflation rates between August and September even though the inflation rate had gone up between the two periods.
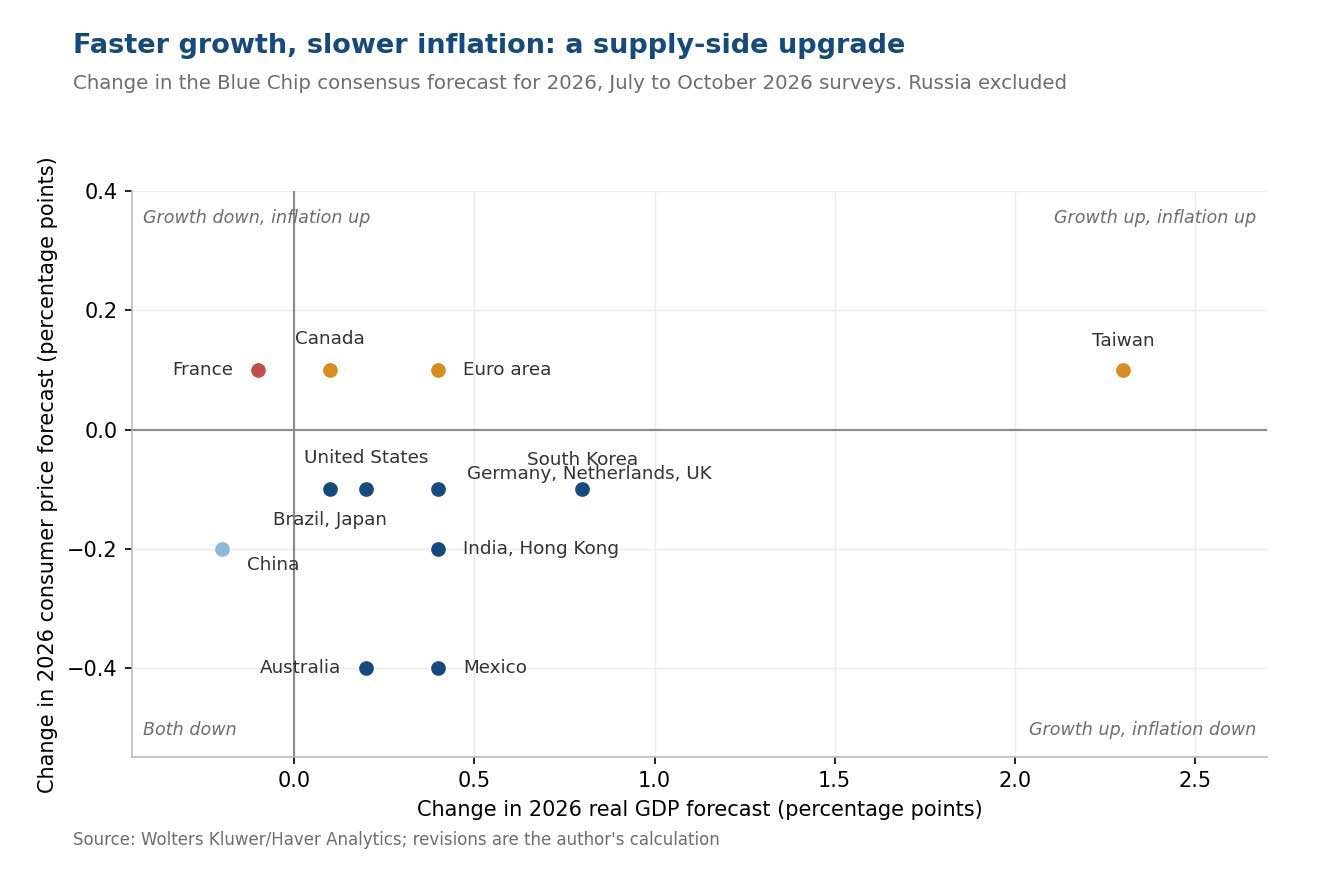
  • The past week saw investors begin to question the AI optimism that has sustained equity markets all year. Asian technology stocks fell sharply, the Nasdaq retreated to its weakest level this month, and government bonds attracted a defensive bid. The reappraisal arguably concerned positioning in the artificial-intelligence complex rather than the macroeconomic backdrop, which, if anything, improved. The October Blue Chip survey delivered growth upgrades across almost the entire panel alongside lower inflation forecasts for this year (chart 1), a combination consistent with an improvement in supply. The same US forecasters, however, made only modest changes to their view of the coming five years (chart 2). Chinese customs figures for September highlighted the growing importance of chips: exports rose 36.3 per cent on the year and the monthly surplus reached 133.5 billion dollars, with semiconductors furnishing close to a quarter of the increase (chart 4). For the European Union, the bilateral deficit with China has widened by more than $60 billion in 12 months (chart 5). Yet the composition of American construction spending (chart 3) and the uses to which European firms actually put AI technology (chart 6) suggest an expansion narrower than the headline figures imply.

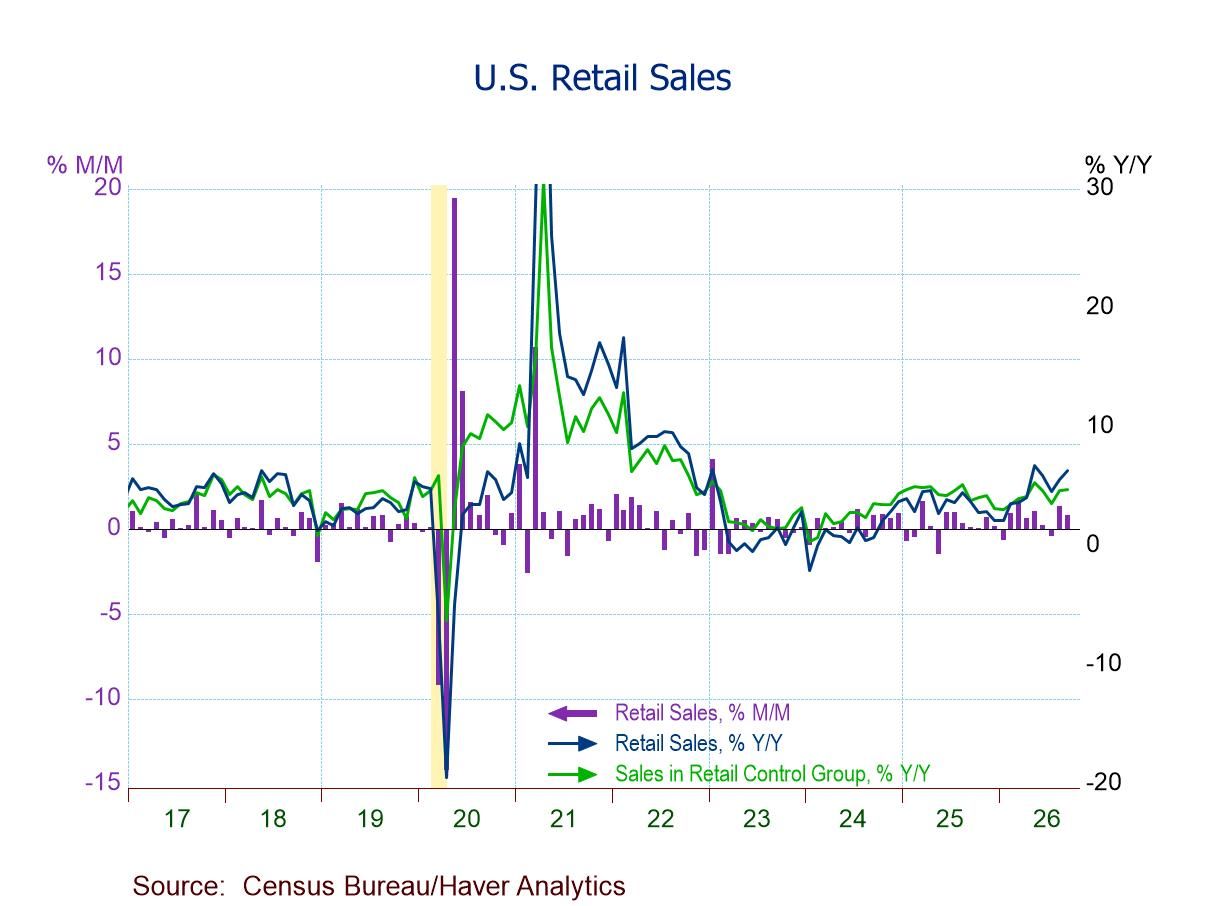
    • Total retail sales +0.8% (+6.3% y/y) in Sept.; seventh m/m increase in eight mths.
    • Ex-auto sales +0.9% (+7.2% y/y), second straight m/m rise; auto sales +0.2% (+2.5% y/y), fourth gain in five mths.
    • Ex-gas sales +0.2% (+4.5% y/y) and ex-auto & gas sales +0.2% (+5.0% y/y); both up m/m from Feb. through Sept. except July.
    • Retail control group +0.1% (+4.7% y/y), seventh m/m rise in eight mths., capping a firm Q3 ’26 for underlying consumer demand.
    • Gains m/m: gasoline stations (+6.4%), department stores (+1.6%), furniture stores (+1.3%), food svcs. (+1.1%).
    • Declines m/m: misc. stores (-3.0%), building materials & garden equipt. (-0.6%), sporting goods (-0.5%), general merch. (-0.1%).
    • Results exceed expectations by wide margins.
    • Yr/Yr percent changes were the sharpest since December 2022.
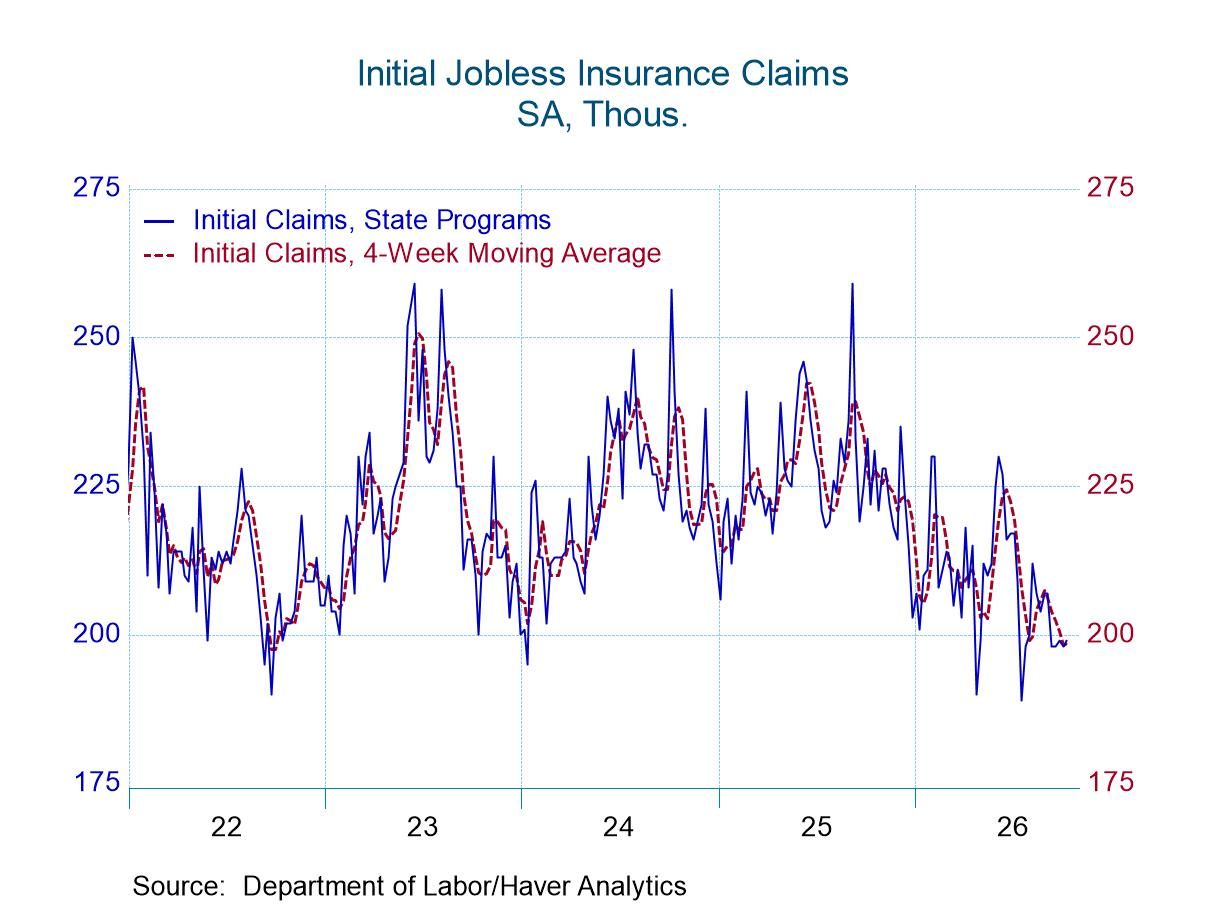
    • New claims rose by 1,000 to 199,000 in the week of October 10.
    • Continuing claims fell by 4,000 to 1.710 million in the week ending October 3.
    • The insured unemployment rate was unchanged at 1.1% in the week of October 3.
  • Europe
    | Oct 15 2026

    EMU IP Weakness Intensifies

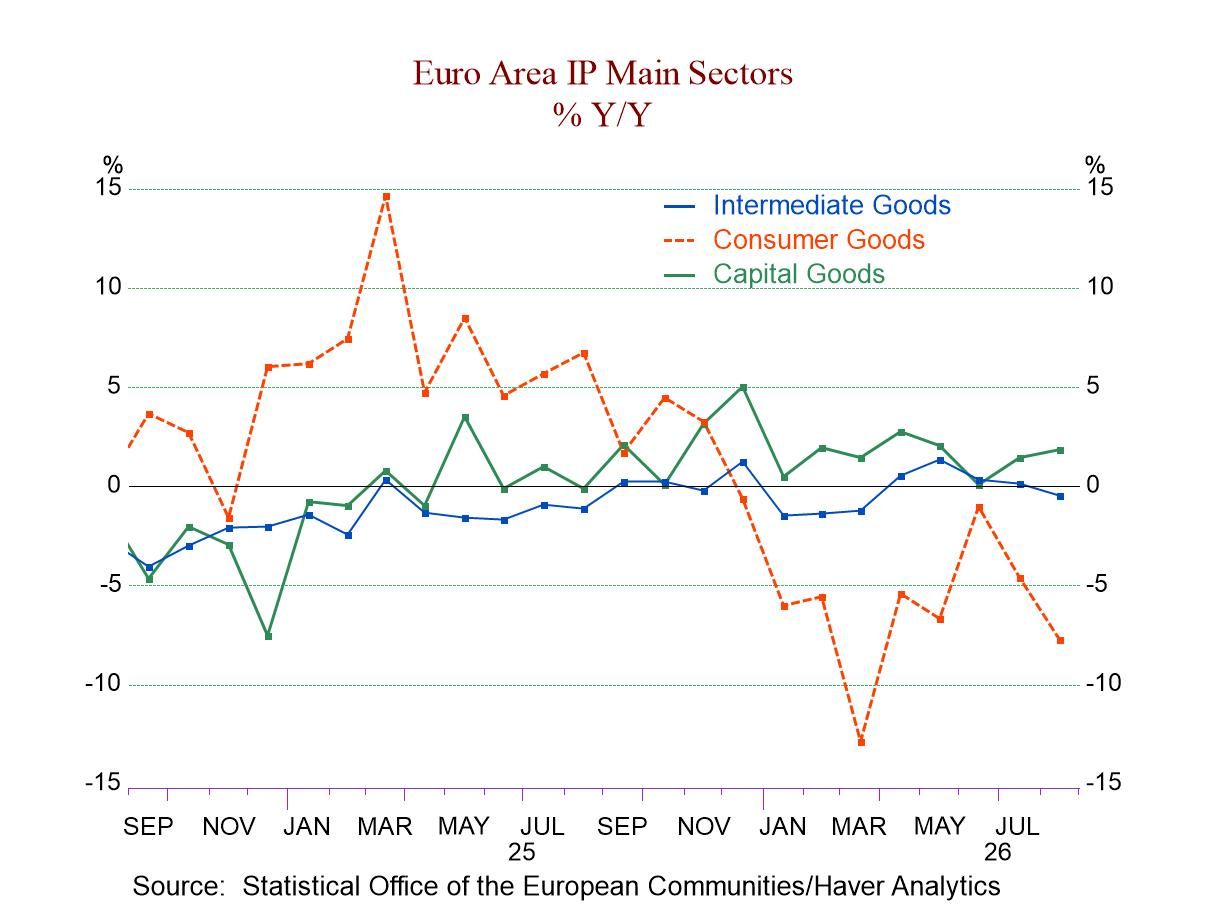
    Industrial and manufacturing output in the European Monetary Union remains under intense downward pressure. The chart that plots the individual sectors highlights year-over-year growth rates. It shows that consumer goods output continues to contract at a pace that is not healthy. Intermediate goods output has basically been at a point of stasis for the last year. Capital goods output continues to be the only robust part of the industrial economy; it shows persistent increases in output since the first quarter of 2025.

    Monthly output The monthly changes showed declines in overall industrial production of 0.5% in August. The decline in manufacturing was 0.4% in August; by sector, consumer goods output declined by 2.4% month-to-month, intermediate goods output declined by 0.8%, while capital goods increased 0.4%. Within the consumer sector, consumer durables had a small output increase of 0.2%, with nondurables output falling by 0.8% month-to-month.

    Sequential growth The sequential growth rates delineate growth over 12 months, six months, and three months, showing some weakness over each of those spans, with output falling by 1.2% over 12 months, being flat over six months, and declining at a 3.6% annual rate over three months. Manufacturing shows a similar trend, with a decline of 1.6% over 12 months, a decline at a 0.2% annual rate over six months, and a decline at a 4% annual rate over three months.

    By sector: The sequential growth rates show declines in consumer output over 12 months, six months, and three months, with weaker growth over three months than over 12 months. For the subsector, consumer nondurables follow the same pattern and trend; so, do intermediate goods. Capital goods are a departure. They show a 1.9% increase over 12 months, a 1.6% annualized increase over six months, and a 2.6% annual rate decline over three months. Next, the only sector showing persisting increases is durable goods within the consumer sector. It shows output up 0.2% over 12 months, rising at a 2.4% annual rate over six months, and accelerating to a 5.3% annual rate over three months. The trends that we see in the headline are echoed in most of the components, which tend to show output declines over 12 months, some moderation over six months, and then an acceleration of weakness over three months. Capital goods also break that pattern by showing persisting deceleration in output growth trends from 12 months to six months to three months.

    Quarter-to-date output: QTD output is falling in all sectors except for consumer durables. The headline shows a 2.7% annual rate decline; manufacturing is at a 3.5% annual rate drop. There is still one month’s worth of data needed to fill out the third quarter.

    Annual growth rate ranking: Growth rates generally are weak. We rank the growth rates on a 20-year timeline back to 2006. The headline series—total industrial production excluding construction and manufacturing—have rankings for year-over-year output growth in their 28th and 25th percentiles, respectively. Consumer goods output for the entire sector has been weaker only 1.7% of the time on this timeline, with most of that weakness due to consumer nondurables output, which has been weaker only 1.3% of the time. Consumer durable goods output is above its median with a 55.5 percentile standing. Capital goods are the only other sector above the 50th percentile, with a 51.7 percentile standing. Intermediate goods come close, with a 48.3 percentile standing, annual growth that is barely below its historic median on this timeline.

    Member country trends The table also presents results for 13 European monetary union member countries and for the United Kingdom and Sweden, as fellow European economies. EMU members show an unweighted average decline across this group of countries of 0.5% for output in August, a weakening from a 0.2% median increase in July and weaker than a 0.1% median gain in June. These countries have median declines of 0.1% over 12 months, 1.5% over six months, and 5.6% over three months. Quarter-to-date, the unweighted average for the group is a 7.5% decline for manufacturing output. Also, the average rank standing for EMU manufacturing growth on the timeline from 2006, as an unweighted average, has a 44.5 percentile standing, below its historic median, which puts it below median by about 6 percentage points. The only countries above their respective medians for year-over-year growth on that timeline are the Netherlands with a 97.5 percentile standing, Greece with an 86.1 percentile standing, Malta with a 69.3 percentile standing, and Spain, whose result is right on top of its median with a 50th percentile standing. There are additional five countries with percentile standings in their 40th percentile, including Finland, Italy, France, Germany, and Austria.

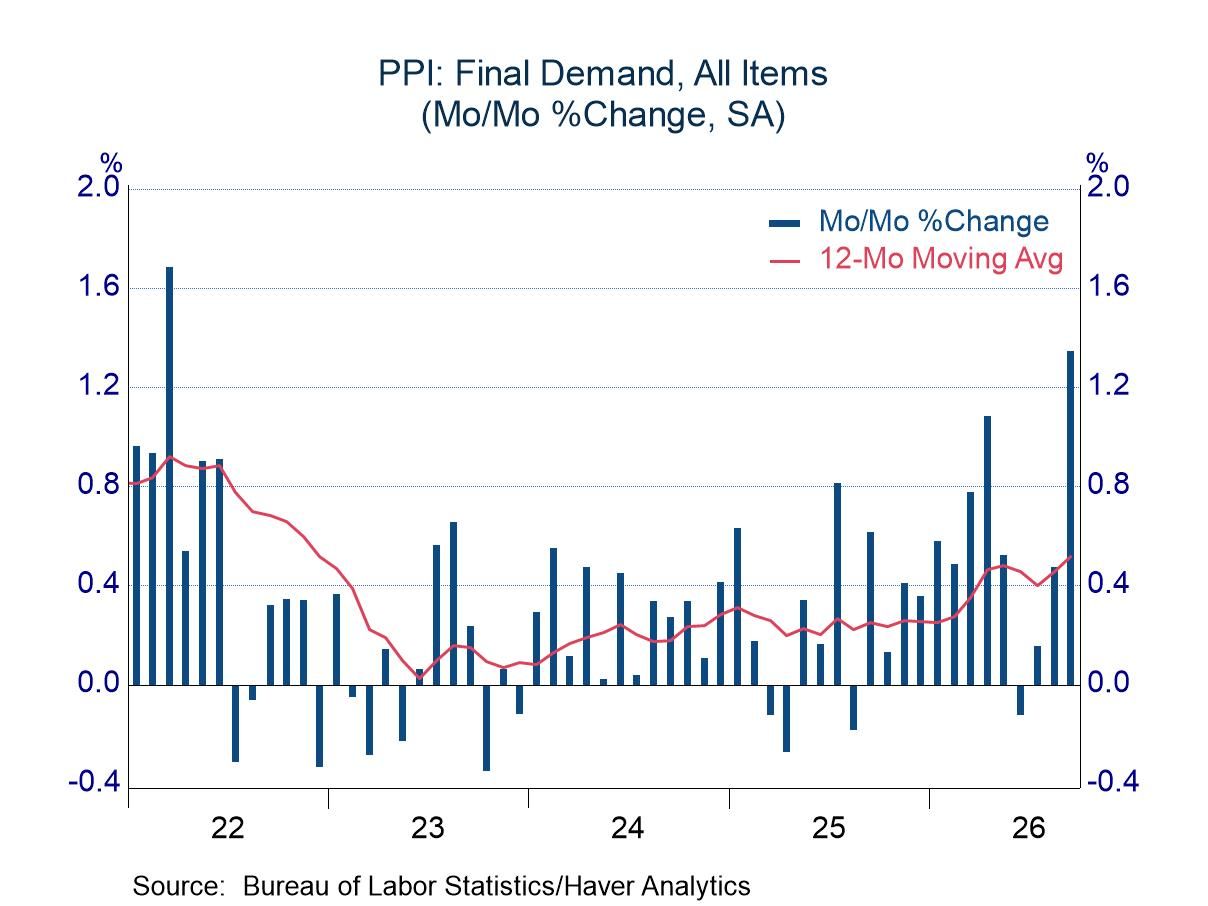
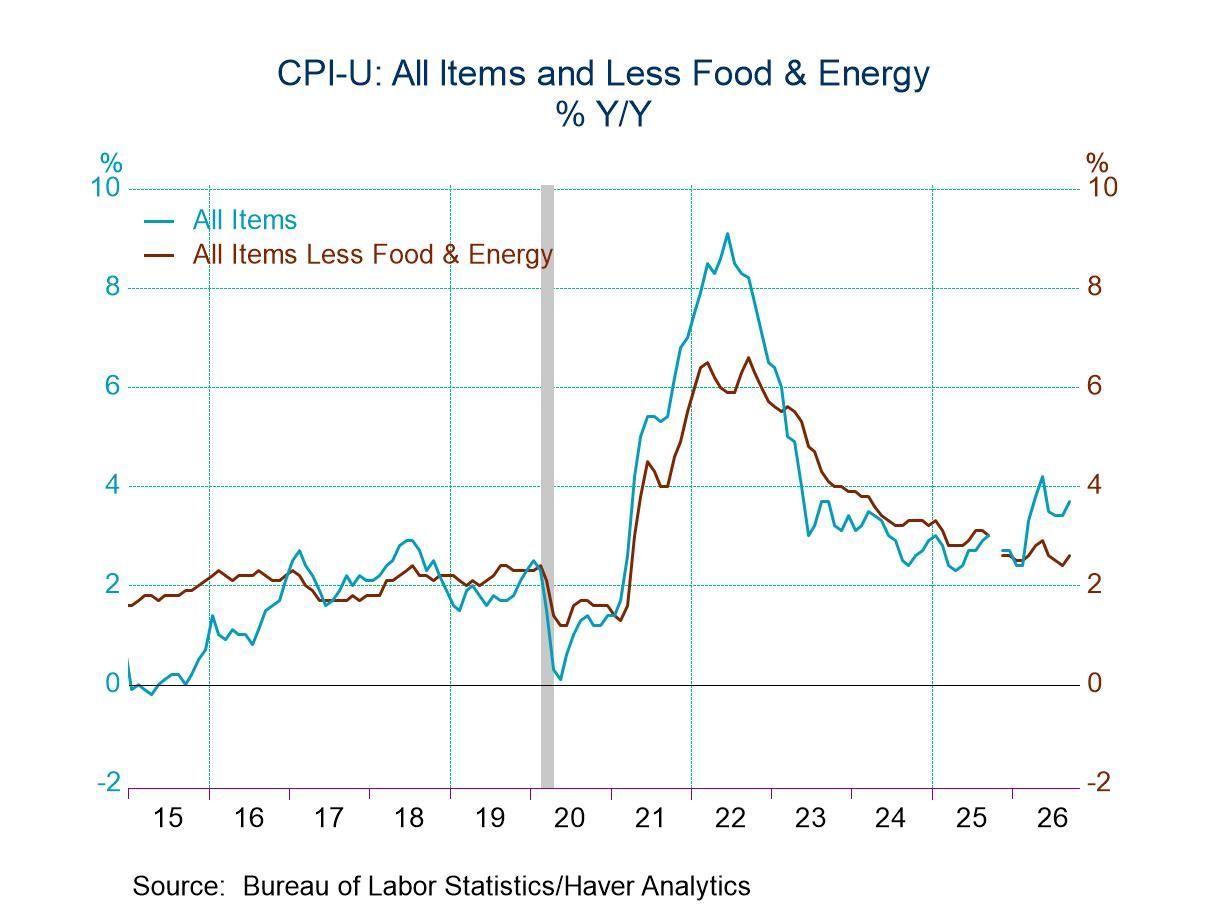
    • Energy drives headline gain.
    • Food prices tame.
    • Core shows underlying price pressures in both goods and services.
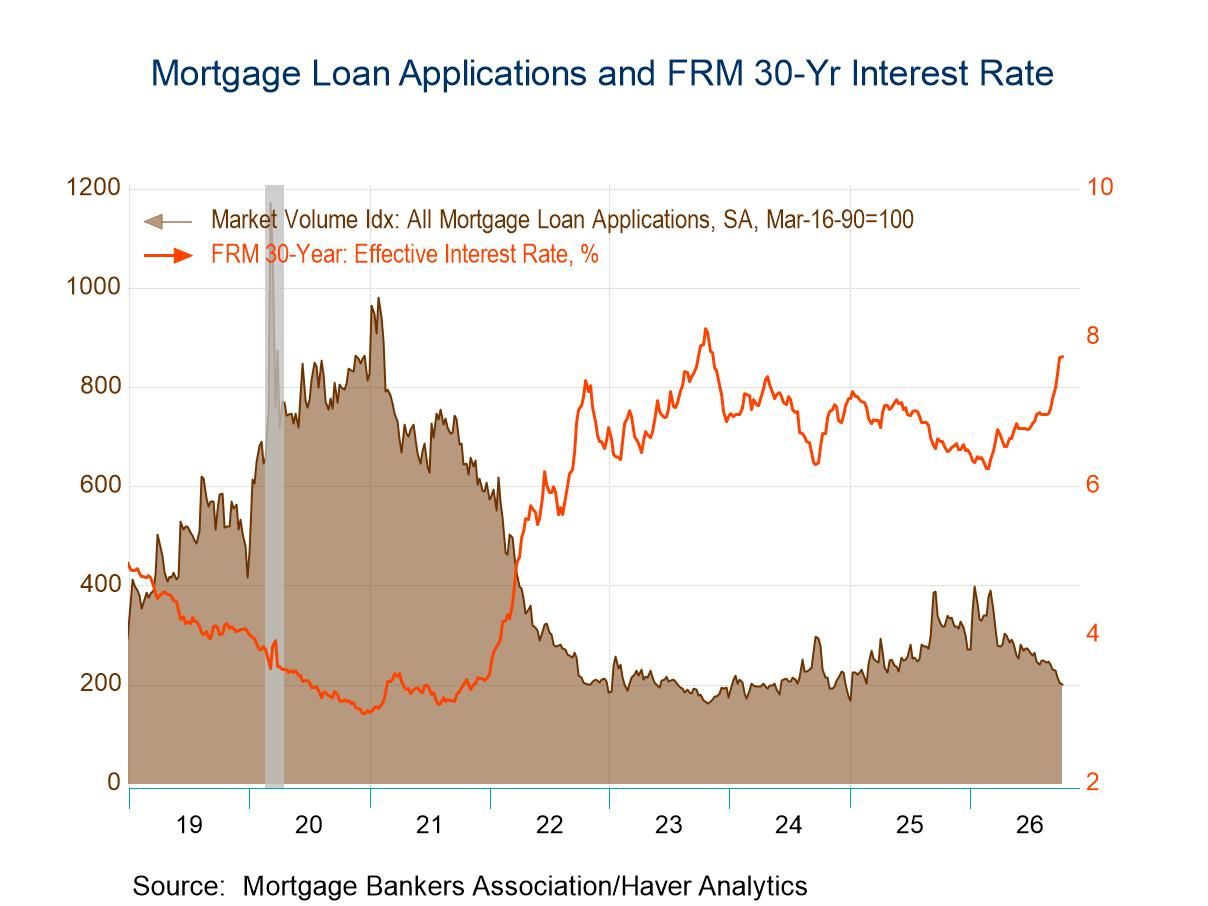
    • Applications for loans to purchase and applications for loan refinancing both declined in the latest week.
    • Interest rate on 30-year fixed-rate loans edged up 2bps to 7.75%.
    • Average loan size fell moderately in the October 9 week.