EMU IP Weakness Intensifies
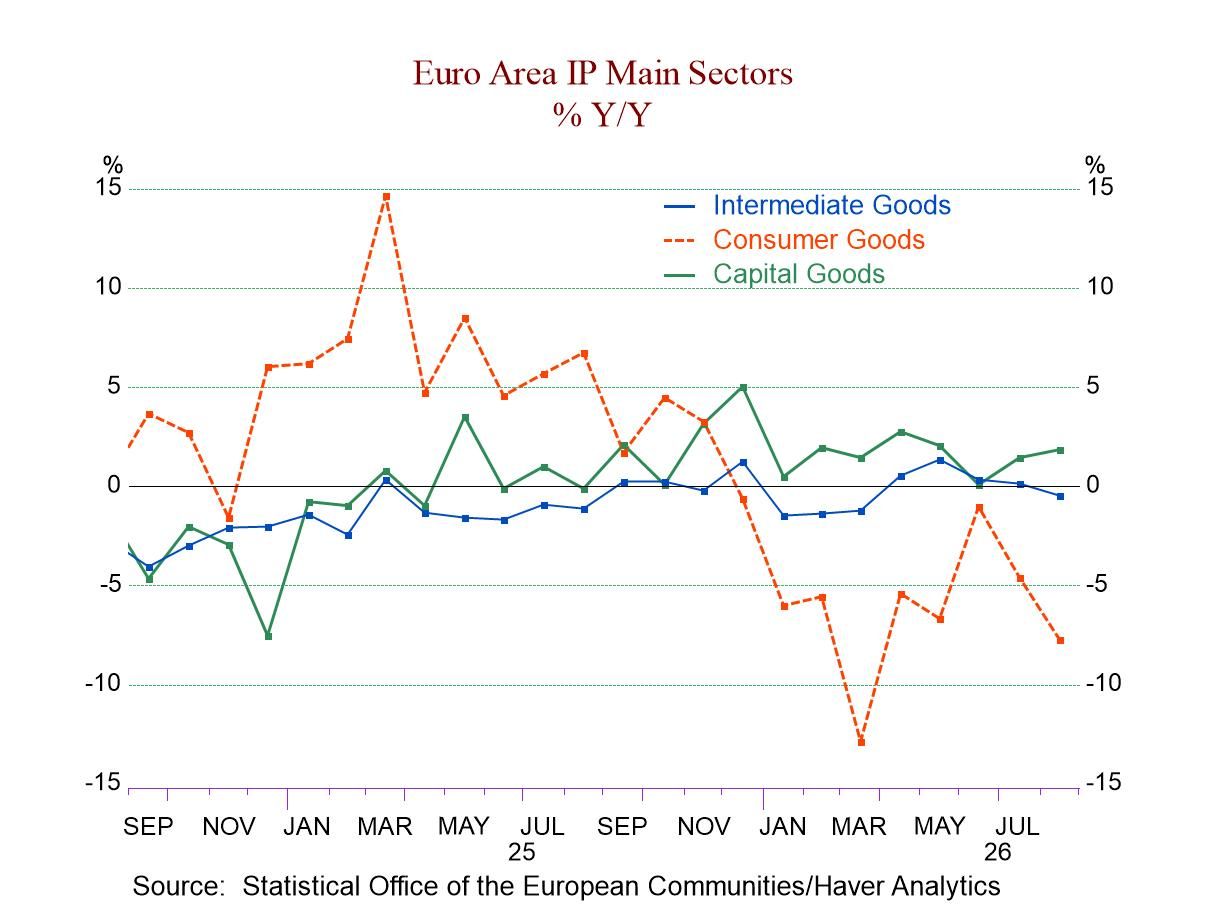
Industrial and manufacturing output in the European Monetary Union remains under intense downward pressure. The chart that plots the individual sectors highlights year-over-year growth rates. It shows that consumer goods output continues to contract at a pace that is not healthy. Intermediate goods output has basically been at a point of stasis for the last year. Capital goods output continues to be the only robust part of the industrial economy; it shows persistent increases in output since the first quarter of 2025.
Monthly output The monthly changes showed declines in overall industrial production of 0.5% in August. The decline in manufacturing was 0.4% in August; by sector, consumer goods output declined by 2.4% month-to-month, intermediate goods output declined by 0.8%, while capital goods increased 0.4%. Within the consumer sector, consumer durables had a small output increase of 0.2%, with nondurables output falling by 0.8% month-to-month.
Sequential growth The sequential growth rates delineate growth over 12 months, six months, and three months, showing some weakness over each of those spans, with output falling by 1.2% over 12 months, being flat over six months, and declining at a 3.6% annual rate over three months. Manufacturing shows a similar trend, with a decline of 1.6% over 12 months, a decline at a 0.2% annual rate over six months, and a decline at a 4% annual rate over three months.
By sector: The sequential growth rates show declines in consumer output over 12 months, six months, and three months, with weaker growth over three months than over 12 months. For the subsector, consumer nondurables follow the same pattern and trend; so, do intermediate goods. Capital goods are a departure. They show a 1.9% increase over 12 months, a 1.6% annualized increase over six months, and a 2.6% annual rate decline over three months. Next, the only sector showing persisting increases is durable goods within the consumer sector. It shows output up 0.2% over 12 months, rising at a 2.4% annual rate over six months, and accelerating to a 5.3% annual rate over three months. The trends that we see in the headline are echoed in most of the components, which tend to show output declines over 12 months, some moderation over six months, and then an acceleration of weakness over three months. Capital goods also break that pattern by showing persisting deceleration in output growth trends from 12 months to six months to three months.
Quarter-to-date output: QTD output is falling in all sectors except for consumer durables. The headline shows a 2.7% annual rate decline; manufacturing is at a 3.5% annual rate drop. There is still one month’s worth of data needed to fill out the third quarter.
Annual growth rate ranking: Growth rates generally are weak. We rank the growth rates on a 20-year timeline back to 2006. The headline series—total industrial production excluding construction and manufacturing—have rankings for year-over-year output growth in their 28th and 25th percentiles, respectively. Consumer goods output for the entire sector has been weaker only 1.7% of the time on this timeline, with most of that weakness due to consumer nondurables output, which has been weaker only 1.3% of the time. Consumer durable goods output is above its median with a 55.5 percentile standing. Capital goods are the only other sector above the 50th percentile, with a 51.7 percentile standing. Intermediate goods come close, with a 48.3 percentile standing, annual growth that is barely below its historic median on this timeline.
Member country trends The table also presents results for 13 European monetary union member countries and for the United Kingdom and Sweden, as fellow European economies. EMU members show an unweighted average decline across this group of countries of 0.5% for output in August, a weakening from a 0.2% median increase in July and weaker than a 0.1% median gain in June. These countries have median declines of 0.1% over 12 months, 1.5% over six months, and 5.6% over three months. Quarter-to-date, the unweighted average for the group is a 7.5% decline for manufacturing output. Also, the average rank standing for EMU manufacturing growth on the timeline from 2006, as an unweighted average, has a 44.5 percentile standing, below its historic median, which puts it below median by about 6 percentage points. The only countries above their respective medians for year-over-year growth on that timeline are the Netherlands with a 97.5 percentile standing, Greece with an 86.1 percentile standing, Malta with a 69.3 percentile standing, and Spain, whose result is right on top of its median with a 50th percentile standing. There are additional five countries with percentile standings in their 40th percentile, including Finland, Italy, France, Germany, and Austria.
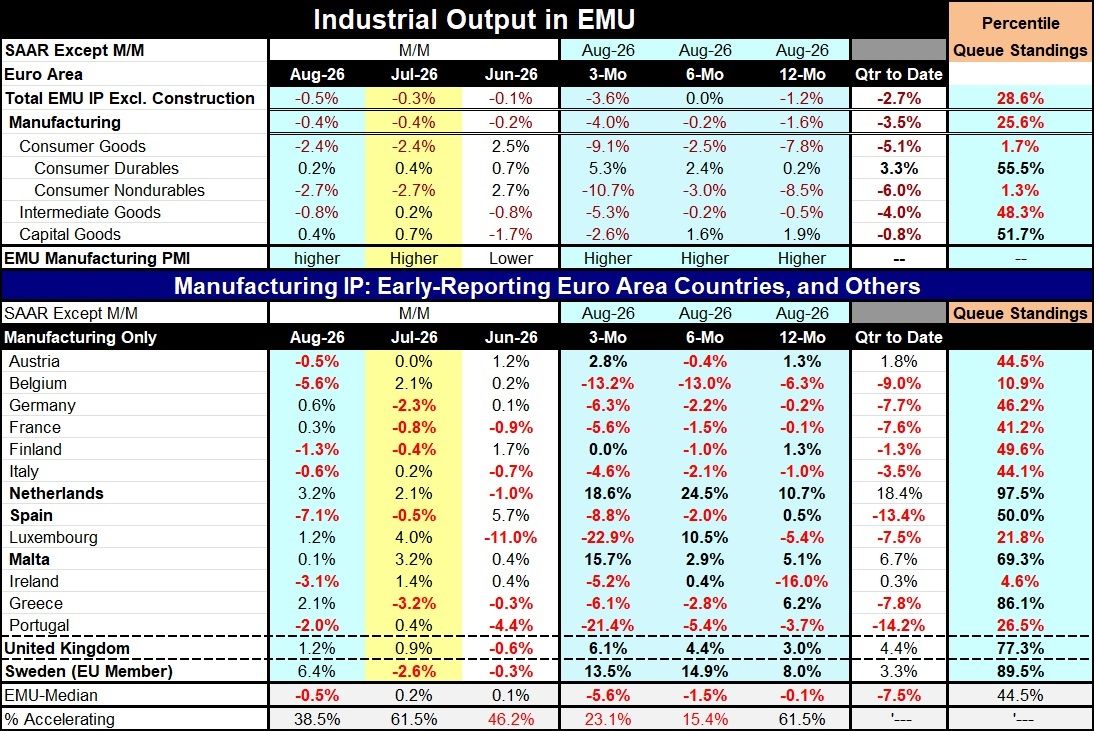
Summing up On balance, this is a weak report with output on weakening trends in most countries. In August, output is accelerating in only 38.5% of the countries. Compared to one year ago, output is accelerating at 61.5% of the member countries. Over six months compared to 12 months, there is acceleration in only 15.4% of the countries. Over three months compared to six months, there is acceleration in 23.1% of these reporting countries. Inflation, for the most part, remains high. The ECB appears to be still raising interest rates, and energy prices remain high amid the Middle East war. It shows no signs of increased predictability, let alone any hints of good news.

Robert Brusca
AuthorMore in Author Profile »Robert A. Brusca is Chief Economist of Fact and Opinion Economics, a consulting firm he founded in Manhattan. He has been an economist on Wall Street for over 25 years. He has visited central banking and large institutional clients in over 30 countries in his career as an economist. Mr. Brusca was a Divisional Research Chief at the Federal Reserve Bank of NY (Chief of the International Financial markets Division), a Fed Watcher at Irving Trust and Chief Economist at Nikko Securities International. He is widely quoted and appears in various media. Mr. Brusca holds an MA and Ph.D. in economics from Michigan State University and a BA in Economics from the University of Michigan. His research pursues his strong interests in non aligned policy economics as well as international economics. FAO Economics’ research targets investors to assist them in making better investment decisions in stocks, bonds and in a variety of international assets. The company does not manage money and has no conflicts in giving economic advice.
More Economy in Brief
 Global