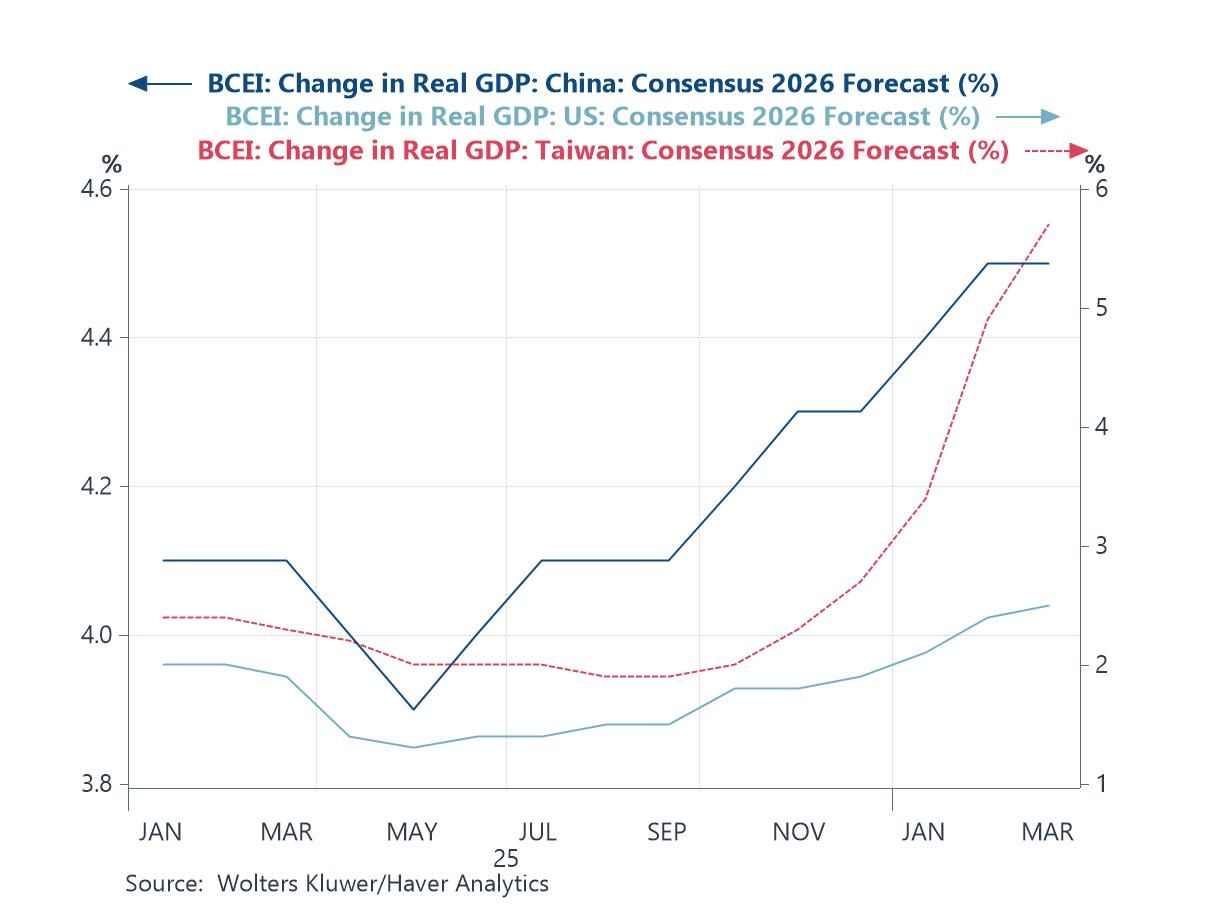
The past few days have seen financial markets rattled by a sharp escalation of tensions in the Middle East, with oil prices rising, risk assets wobbling and investors reassessing the potential macroeconomic fallout from a possible energy shock. Yet, taken together, this week’s charts suggest that the global economic outlook has so far remained relatively resilient. Blue Chip consensus forecasts for 2026 growth have held steady in recent months, with Taiwan’s steadily improving outlook hinting at the ongoing influence of the global AI investment cycle. That said, forward-looking sentiment indicators are beginning to show some cracks: the latest Sentix expectations index registered a sharp deterioration in March, potentially reflecting rising geopolitical uncertainty. Inflation expectations, by contrast, have shifted only modestly, with forecasters making few meaningful revisions despite the recent surge in oil prices. Financial markets appear to share that view, as movements in two-year US Treasury yields—often a proxy for expectations of Federal Reserve policy—have not mirrored the sharp rise in crude prices, suggesting investors currently see the oil shock as temporary. The final charts highlight why energy markets nonetheless remain central to the outlook: many major economies remain significant net oil importers, and in much of Asia oil price movements feed quickly into consumer energy inflation. Should geopolitical tensions persist and keep crude prices elevated, these channels could yet transmit broader macroeconomic pressures in the months ahead.
 Global| Mar 11 2026
Charts of the Week: Geopolitics Meets the Global Economy
by:Andrew Cates
|in:Economy in Brief
 USA| Mar 11 2026
February CPI: Moderate Increase Despite Jumps in Volatile Areas
- Food and energy post above-average price increases.
- Ex food and energy, apparel and airfares misbehave...
- ...but most other areas showed modest price changes.
 USA| Mar 11 2026
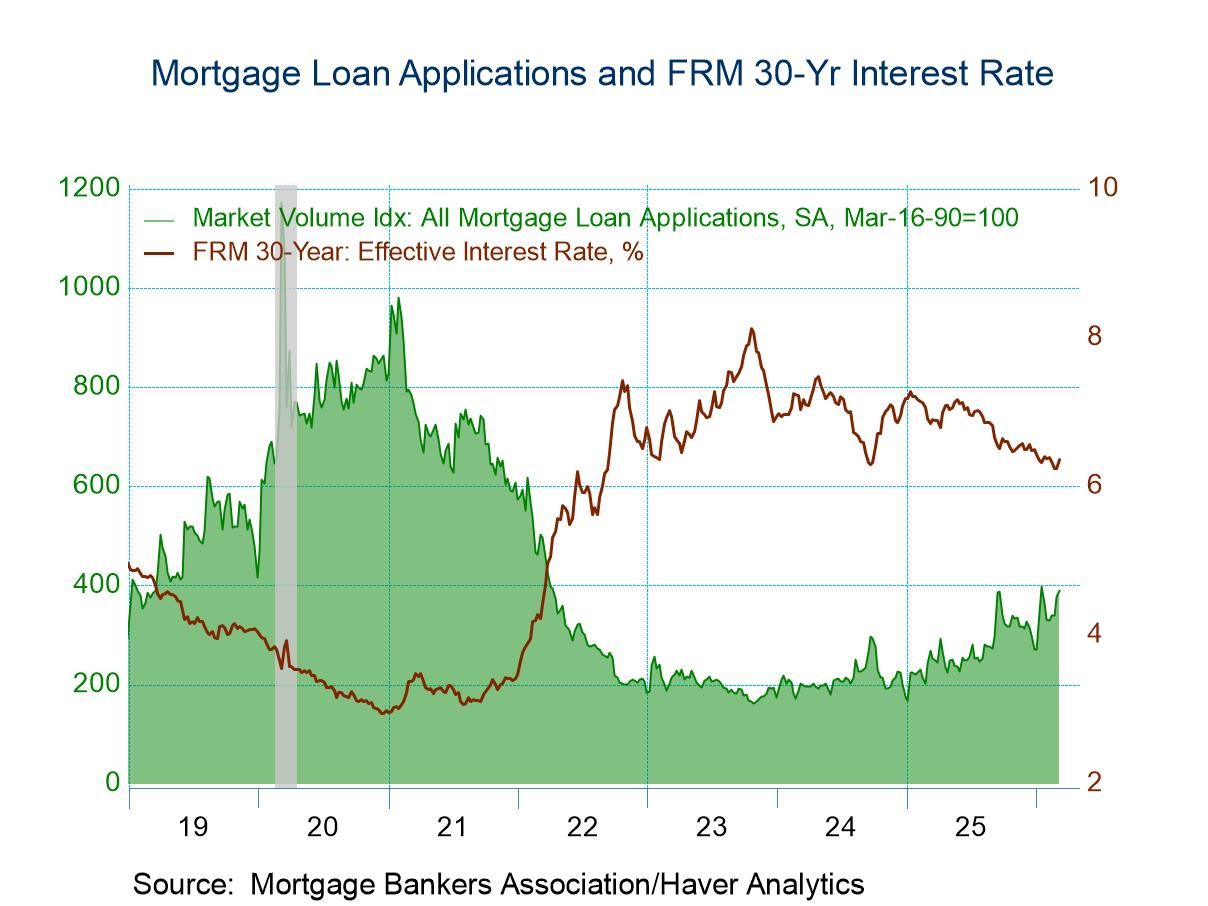
U.S. Mortgage Applications Rose Again in the March 6 Week
- Both applications for loans to purchase and for loan refinancing rose.
- Effective interest rate on 30-year fixed loans rose 12bps to 6.36%.
- Average loan size declined.
 Japan| Mar 11 2026
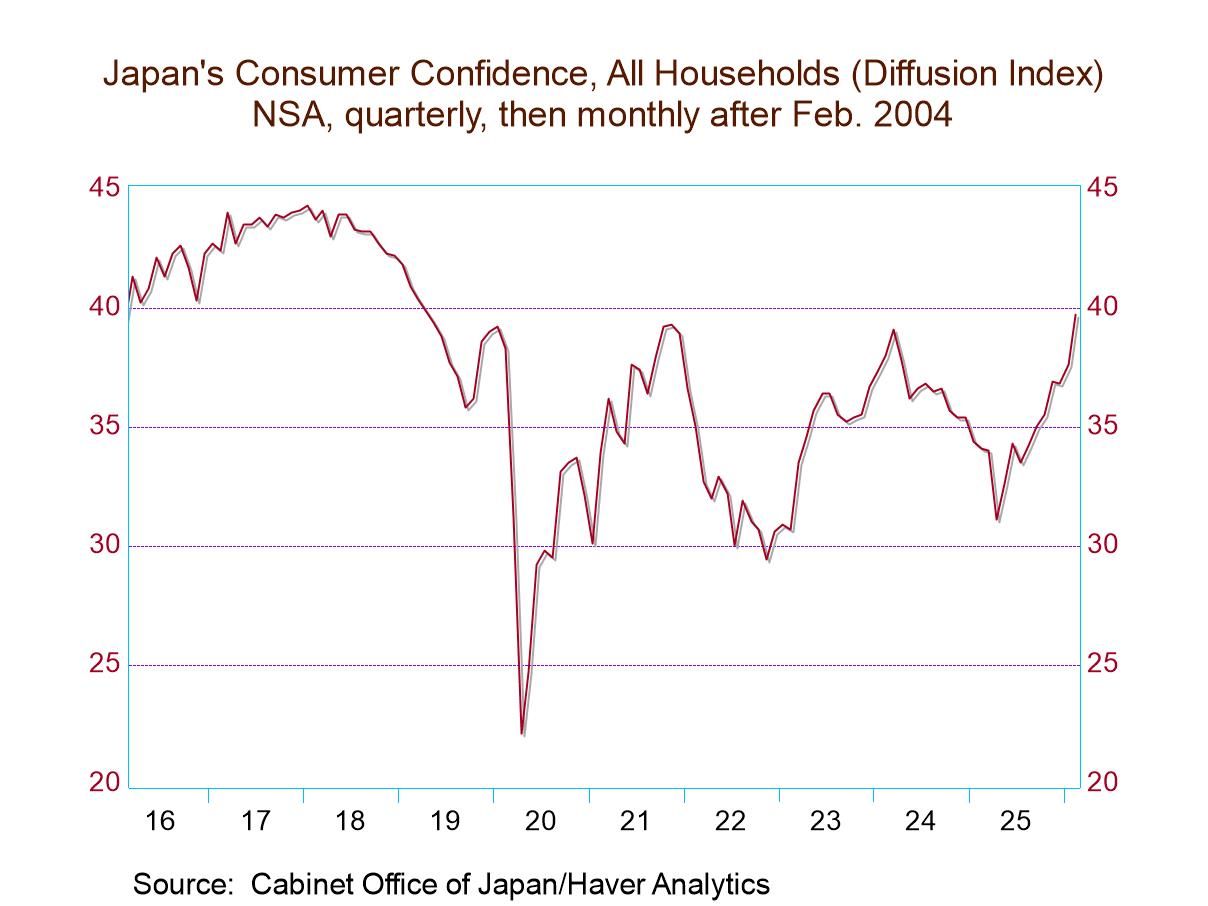
Japan Indicators: Strong Economy—Still, Large Question Marks
Japan's economy may not be firing on all cylinders, but the economy is looking pretty firm, and consumer confidence is just pushing up through an area that has defined several of its post-COVID peaks. Inflation in Japan is uncomfortable. The PPI index rose 0.2% in January and is running at 2.4% year-over-year. The headline CPI for January declined by 0.1% and is running at a 2.4% annual rate, above the Bank of Japan’s preferred target. However, it only has a 61.7 percentile standing compared to a 71.7 percentile standing for the PPI—above its median but not terribly high on data back to 2006.
Retail sales: Key Japan activity variables are showing sustained expansion. Retail sales in January rose by a sharp 4.6%. The sequential growth rate for retail sales mushrooms from a 1.9% pace over 12 months to a 7.3% pace over six months to 15.8% pace over three months. That’s very solid and extremely strong.
Exports: But with the yen weak on global exchange markets, Japan's exports rose by 9.9% in January. The sequential growth rate for exports is 16% over 12 months, which jumps to a 38.7% pace over six months and then jumps again to a 67.8% annual rate over three months. These are stunningly strong figures.
Jobs: Employment in Japan continues to show month-to-month gains, but the gains are not historically strong, even though the sequential performance is sound at 0.5% growth over 12 months and picking up to 0.6% at an annual rate over three months. That’s not bad for a country with fading demographics. However, the standing for employment is only at its 45th percentile, putting it below its median, which occurs at a ranking of 50%. On the other hand, the ranking is not far below its median, with its 45.3 percentile standing.
LEI: Japan's leading economic index rose by 1.9% in January, accelerating from its December increase of 0.6%. Again, the sequential growth rates for the LEI are strong and hint at acceleration, with a 2.5% gain over 12 months, a 9.9% annual rate gain over six months, a pace that is nearly maintained over three months, where the growth rate comes in at a nearly identical 9.2%.
Surveys: The LEI, viewed as a level, is showing ongoing gains and has a historic standing that is near its historic median. The economy watchers index has weakened in the past few months, but the sequential averages show ongoing upward momentum and a historic ranking above its median at a standing in its 52nd percentile.
Inflation: The inflation numbers are the ‘fly in the ointment’ for Japan, although neither the PPI nor the CPI headline (headline excluding fresh food) shows a tendency - a strong tendency - to accelerate. However, there's a war in the Middle East. Oil prices are going up, and that’s going to hit Japan hard — and it’s going to have an inflation effect.
What will central bankers do? One of the key questions moving forward is how central banks are going to deal with the inflation effects from oil, because while it clearly gives a supply shock, it's a relatively large one and nobody is sure how long-lived it's going to be and how much of this supply shock will get into the core inflation measures beyond just the headline.
 USA| Mar 10 2026
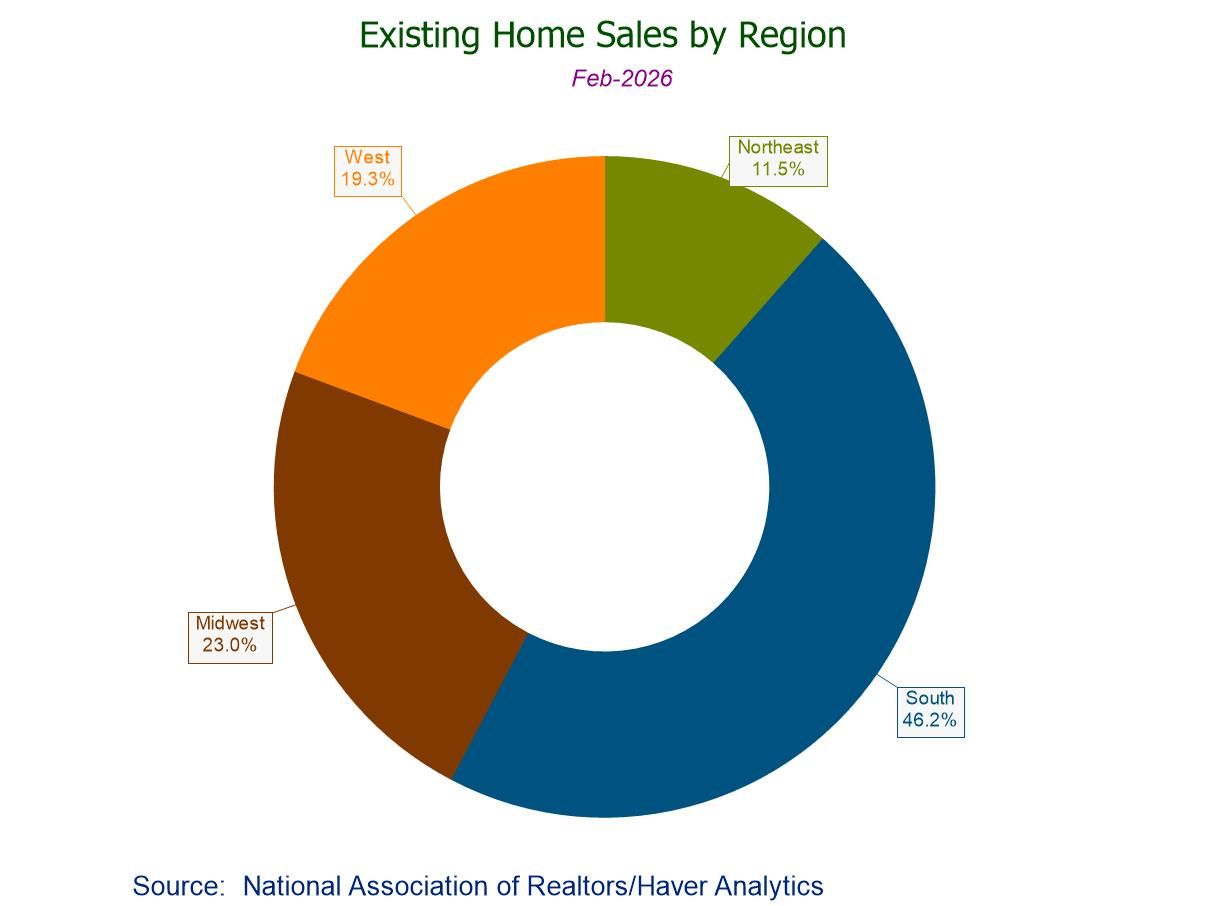
U.S. Existing Home Sales Unexpectedly Rebound in February
- February sales +1.7% to 4.09 mil.; -1.4% y/y, fourth straight y/y decline.
- Sales m/m up in the West (+8.2%), South (+1.6%), and Midwest (+1.1%), but down in the Northeast (-6.0%).
- Median sales price +0.8% (+0.3% y/y) to $398,000, first m/m increase since October.
- Unsold inventory +2.4% (+4.9% y/y) to three-month-high 1.29 mil. units; 3.8 months' supply.
 Germany| Mar 10 2026
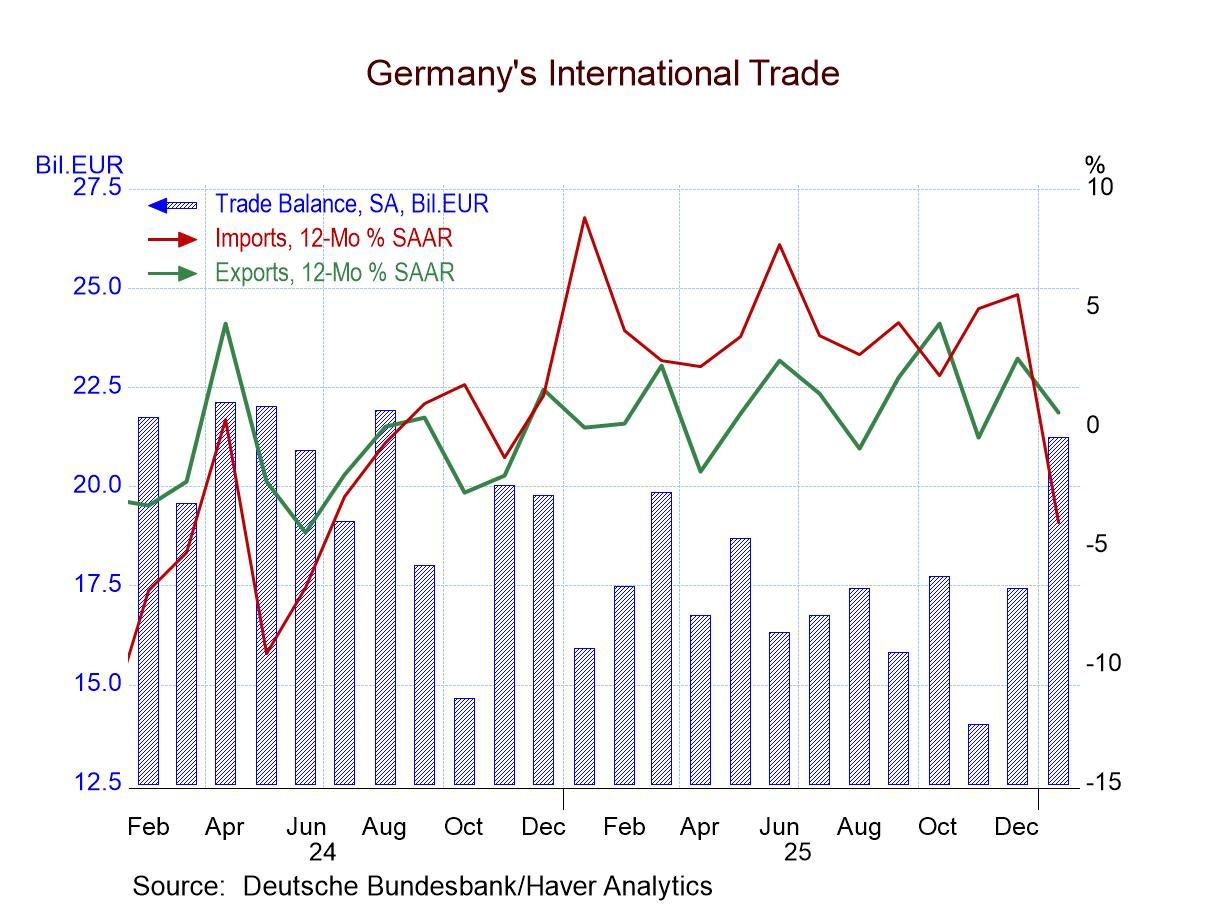
German Exports and Imports Slide in January; Sharp Import Drop Boosts Surplus
German trade flows weakened in January, with imports dropping 5.9% month to month and exports falling 2.3%. With both flows falling sharply and imports dropping at more than twice the rate of exports, the trade surplus in the month ballooned to €21.2 billion from €17.4 billion in December.
The progression of nominal growth rates for exports shows the slowing from 0.6% over 12 months to 0.3% over six months to -3.1% at an annual rate over three months. The import decline is weaker and is gathering even more downward momentum, with imports falling 4% over 12 months, dropping at a 7.4% annual rate over six months, and reaching a 15% annualized decline over three months.
Measured in real terms, exports fell by 2.9% in January as imports fell by 6.8%. The sequential growth rates for German exports and imports both show progressive deterioration, with imports weakening faster than exports. This trend is worrisome because it says that the nominal weakness is not just because of what prices are doing. Weak imports usually indicate weak domestic demand; for Germany, that could be a really bad signal. In addition, because Germany exports so much to other EMU nations, German export weakness raises questions about demand strength among fellow EMU members - and about global demand in general.
Lagged trends Lagged results give us a look into export and import trends with a one-month lag. As of December, both exports and imports still rose month-to-month. Sequential export growth was steadily accelerating, while sequential import growth rates were already decaying. German consumer goods exports were accelerating sequentially, and the ‘other exports’ category is not on its own acceleration path, but the category remains strong.
For imports, the overall nominal flows were decelerating from 12-months to 6-months to 3-months. Capital goods and motor vehicle imports both showed sequential weakening. Consumer goods imports were oscillating but still generally strong. Other imports were on a recent accelerating path, switching from negative 12-months growth to a 1% gain over six months and a 4% pace of increase over three months.
Summing up On balance, German trade trends show a lot of weakness. Much of it seems to have welled up in January ahead of the new Middle East conflict. Right now, German economic data and diagnostic trade data are not sending out good signals about the German economy.
 Germany| Mar 09 2026
German Output Trends in January Break Lower
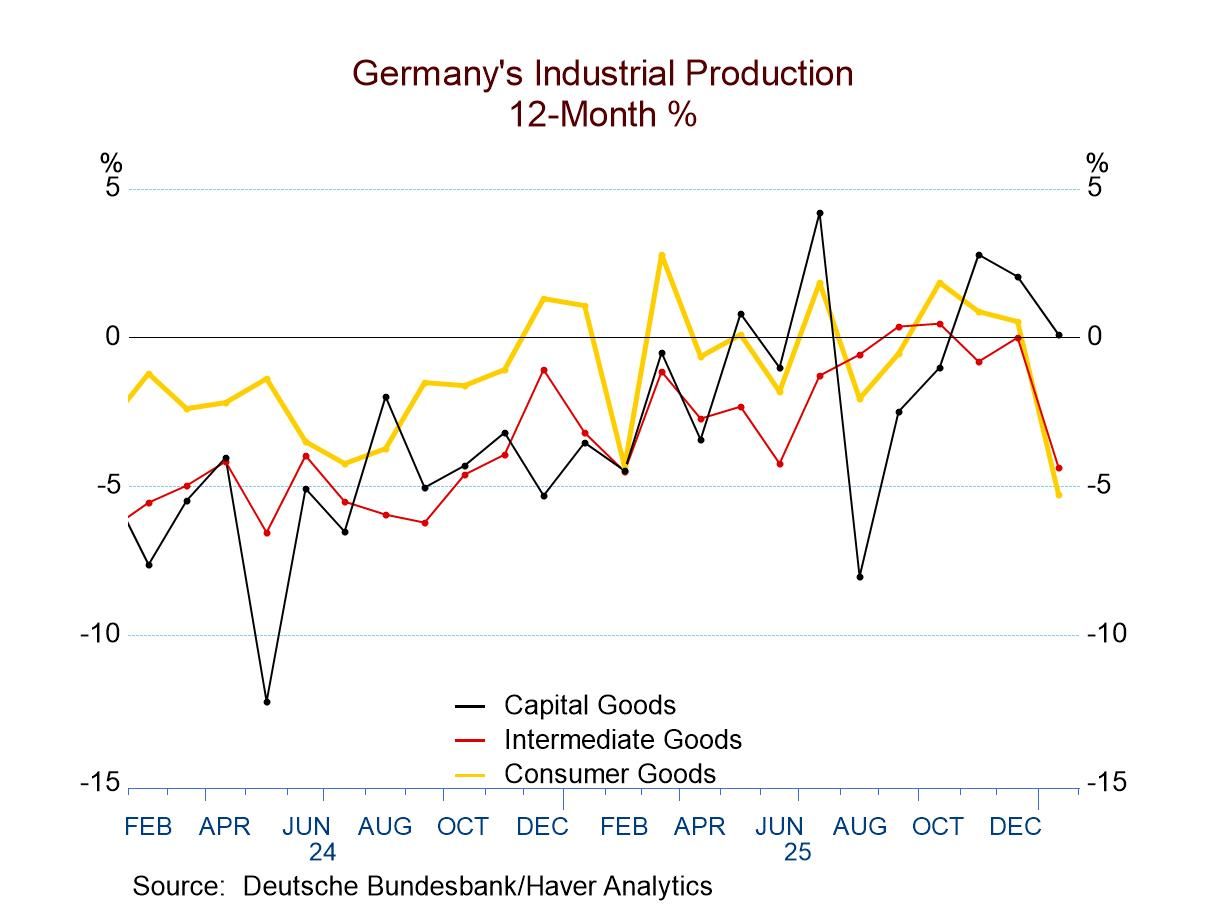
The German industrial sector falters German industrial output in January fell for the second month in a row; it has a sequential pattern of growth rates becoming progressively weaker from 12-months to six-months to three-months. This is not a good pattern or development. Orders also fell sharply in January, dropping by 11.1% month-to-month. At least the orders progression is not as clearly negative as it is for industrial output, but over three months real manufacturing orders are declining at a 1.8% annual rate even though the 12-month and six-month growth rates of orders still show solid positive growth results.
These data are up-to-date through January, so they do not contain any effects of the new conflict in the Middle East.
Sequential output trends German industrial output trends show progressively weaker numbers from 12-months to six-months to three-months. Consumer goods output and intermediate goods output show progressively weaker sequential results. Capital goods output shows a skinny rise of 0.1% over 12 months, a 6.6% decline at an annual rate over six months, and then a lesser pace of decline of 2.8% over three months. Capital goods output is not getting progressively weaker; however, it has been weakening and the trend is disappointing.
German survey results are less dire Other indicators of German industrial activity generally show improved monthly results. All four of the metrics in the table show improved survey values in January compared to December, but December had showed weakness relative to November across the board for those 4 metrics. The message from progressive averages in the table, from these other indicators, is that not much has changed that would allow us to discriminate strongly among activity performances reported over 12 months, six months, or three months. In the end, the three-month values are generally slightly stronger than the 12-month values, but not in a way that looks significant, and even that result does not hold for the ZEW current index.
Industrial production in other Europe Industrial production trends for other European reporters show declines in output in January of a fairly substantial magnitude in Spain and in Ireland, against strong increases in Portugal, Sweden, and Norway, and the more modest increase in France. IP in January shows cross-currents and a good deal of extremism in other Europe. The progressive trends for manufacturing production show Spanish and Irish trends deteriorating sharply from 12-months to six-months to three-months France and Portugal report uneven results that do not clarify what the underlying trend is doing. However, in northern Europe, Sweden and Norway are showing sharply accelerating growth from 12-months to six-months to three-months.
Quarter-to-Date (as of January) In the quarter to date, German manufacturing output is falling overall and for all its major components. German real manufacturing orders are falling at a 30.3% annual rate in the quarter to date, which is a nascent statistic since only January data are available now. The other industrial indicators show positive trends for most measures, with the IFO manufacturing expectation being the exception, as it weakens. Industrial production for other Europe shows sharp quarter-to-date declines in Spain and Ireland, with extremely strong quarter-to-date results in Sweden and Norway; there is strong performance from Portugal and a solid increase from France.
 USA| Mar 06 2026
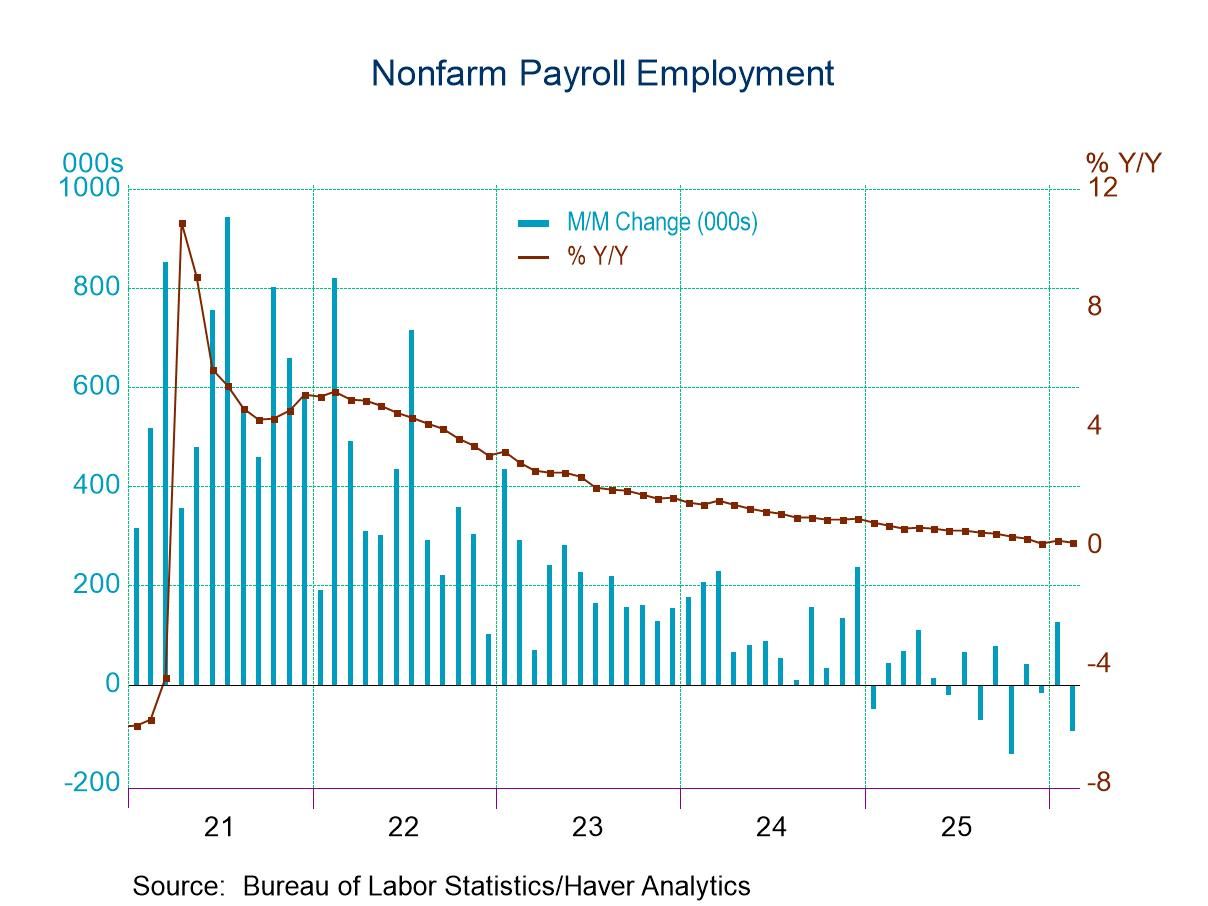
U.S. Employment Unexpectedly Fell in February
- Nonfarm payrolls fell 92,000 in February with downward revisions to both December and January
- Private sector payrolls fell 86,000 in February.
- Average hourly earnings annual growth increased to 3.8% from 3.7% in both December and January.
- Unemployment in the household survey increased 203,000, pushing the unemployment rate up to 4.4% from 4.3% in January.
- The delayed population adjustment to the household data was a very large negative as had been expected given the observed declines in immigration.
by:Sandy Batten
|in:Economy in Brief
- of2725Go to 25 page