The ADP National Employment Report, from the payroll processor, indicated that private nonfarm payrolls fell 23,000 last month after a slightly revised increase of 119,000 during January.
 Global| Mar 05 2008
ADP Report: Private Payrolls Fell
by:Tom Moeller
|in:Economy in Brief
- Global| Mar 05 2008
U.S. Productivity Growth Revised Little, Unit Labor Costs Revised Up
Nonfarm labor productivity growth during 4Q07 was revised little, to 1.9% growth from 1.8% reported initially. The figure still is a marked slowdown from the 3Q figure of 6.3% during 3Q07 which was revised up slightly. Consensus [...]
by:Tom Moeller
|in:Economy in Brief
- Global| Mar 04 2008
EMU GDP Growth Decelerates
EMU GDP rose at an annual rate of 1.5% in Q4 bringing its year/year growth down to 2.2% from 2.6% in 2007-Q3. Private consumption spending fell by 0.3% at an annual rate. Domestic demand in total was flat in the quarter and is rising at a 1.9% annual rate over four quarters. Export growth slowed sharply in the quarter and is showing a decline in its year-over-year rate. Imports fell in Q4 and their growth also has been moderating in 2007. Euro growth shows broad based slowing, but growth that is still holding up. Private consumption is weak and that remains a sticking point within the EMU.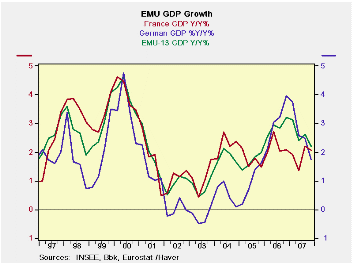
European GDP EU-13 GDP Consumption Capital Formation Trade Domestic
DemandPrivate Public Total Excl
HousingHousing X-M:
Bil EurosExports Imports % Change Q/Q; X-M is Q/Q Change in Bil of Euros Q4-07 1.5% -0.3% -0.3% 1.0% #N/A #N/A #N/A 2.2% -1.5% 0.0% Q3-07 3.0% 2.0% 2.7% 8.7% 10.4% 3.3% -2.3 8.6% 10.3% 3.6% Q2-07 1.1% 2.5% 0.7% -5.6% -5.7% -5.5% 5.0 3.2% 1.2% 0.3% Q1-07 3.2% 0.2% 4.4% 14.2% 16.6% 7.1% -2.7 3.7% 5.7% 4.0% % Change Yr/Yr; X-M is Yr/Yr Change in Gap in Bil of Euros Q4-07 2.2% 1.1% 1.8% 4.3% #N/A #N/A #N/A 4.4% 3.8% 1.9% Q3-07 2.6% 1.6% 2.2% 3.3% 3.7% 2.1% 11.0 7.1% 5.9% 2.1% Q2-07 2.4% 1.6% 2.1% 3.1% 3.4% 2.4% 8.8 5.8% 5.0% 2.0% Q1-07 3.1% 1.4% 2.2% 7.5% 7.8% 6.6% 6.6 6.6% 6.0% 2.9% 5-Yrs 2.0% 1.5% 1.7% 3.8% #N/A #N/A na 5.4% 5.5% 2.0% - Global| Mar 04 2008
Euro Area Producer Prices Surge in January; Core Elevates Too
The Euro Area PPI rose by 0.8% in January. Excluding energy, prices rose by 0.6%. Headline inflation is accelerating. Ex-energy inflation is stubborn just above the 3% mark. Among the major three categories, inflation is subdued only for capital equipment, rising at a pace of 1.3% year-over-year. Consumer goods inflation is oscillating in the 4% to 5% range over the past year. Intermediate goods prices have been above the 2% mark in recent months. Across the largest EMU economies ex-energy inflation is tame only for Germany. For France and Italy ex-energy inflation is around 3%. In the UK ex-energy inflation is 3.9% and accelerating to over 5% over three months.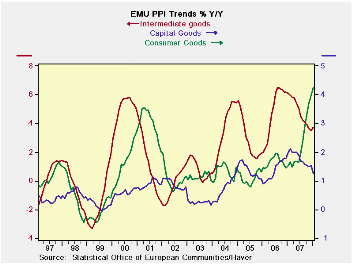
Euro Area and UK PPI Trends M/M SAAR Euro Area 15 Jan-08 Dec-07 3-Mo 6-MO Yr/Yr Y/Y Yr Ago Total PPI ex Construction 0.8% 0.1% 7.4% 6.0% 4.9% 3.1% Excl Energy 0.6% 0.1% 3.1% 3.3% 3.3% 3.5% Capital Goods 0.3% 0.1% 1.6% 1.4% 1.3% 2.0% Consumer Goods 0.5% 0.3% 4.8% 5.6% 4.2% 1.5% Intermediate & Capital Goods 0.7% 0.0% 2.3% 2.1% 2.8% 4.5% Energy 1.4% 0.2% 21.9% 15.6% 10.6% 1.6% MFG 0.5% 0.1% 5.2% 4.7% 5.1% 2.4% Germany PPI 0.8% -0.1% 6.5% 4.6% 3.3% 3.2% Ex Energy 0.4% 0.0% 1.4% 2.2% 2.5% 2.9% France PPI 0.5% 0.1% 5.7% 5.3% 4.9% 1.8% Ex Energy 0.4% 0.2% 2.9% 3.3% 3.0% 2.8% Italy PPI 0.4% 0.1% 6.7% 5.9% 5.2% 4.0% Ex Energy 0.5% 0.0% 2.8% 2.8% 3.0% 4.4% UK PPI 1.3% 1.3% 24.8% 18.7% 7.9% -1.4% Ex Energy 1.0% 0.3% 5.7% 4.6% 3.9% 3.2% Euro Area 15 Harmonized PPI excluding Construction The EA 15 countries are Austria, Belgium, Cyprus, Finland, France, Germany, Greece, Ireland, Italy, Luxembourg, Malta, Netherlands, Portugal, Slovenia and Spain. - Global| Mar 04 2008
Slovakia and Romania Report Increases in Q4, 2007 GDP
Contrary to the slowdowns taking place in the United States and Western Europe both Slovakia and Romania reported increases in economic activity in the last quarter of 2007. Slovakia reported a resounding increase of 14.26% and [...]
- Global| Mar 04 2008
U.S. Chain Store Sales Down Last Week, Up Last Month
The International Council of Shopping Centers ICSC-UBS Chain Store survey indicated that chain store sales fell 0.6% last week. The decline finished a four week period during which sales moved sideways. However, due to a firm 1.7% [...]
by:Tom Moeller
|in:Economy in Brief
- Global| Mar 04 2008
U.S. Vehicle Sales in February Remained Low, Gasoline Price Up
With just a 0.3% m/m uptick, the increase in U.S. sales of light vehicles last month did little to recover a 5.4% January drop. At a 15.38M unit annual selling rate, sales remained quite low. According to the Autodata Corporation [...]
by:Tom Moeller
|in:Economy in Brief
- of15Go to 14 page