Haver Analytics
Haver Analytics

Featured Data Additions: 2026

  • EMERGEFMLiberia → International Trade and BOP → Trade by Country

    International trade statistics by country for Liberia were added to EMERGEFM. Imports and exports to and from Africa, Asia & the Middle East, Europe & Oceania, and the Americas & the Caribbean including 39 individual countries are available. Annual data reported in USD are sourced from the Central Bank of Liberia and start in 2010.

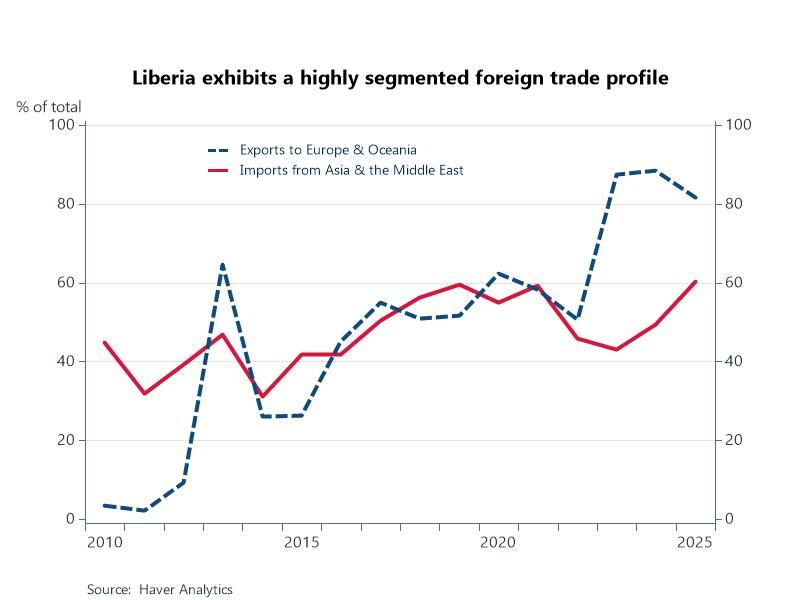
    Chart: Liberia exhibits a highly segmented foreign trade profile where Europe dominates export destinations, while Asia serves as the primary source for the country's imports. Europe is the destination for 82% of exports, of which 73% goes to Switzerland in the form of unwrought gold. 60% of Liberia's imports - led by machinery, petroleum, and manufactured goods - originate from Asia & the Middle East with China, India, and Turkey as the leading suppliers, accounting for 84% of imports from that region.
  • EMERGEFMLiberia → Production

    Production statistics for Liberia were added to the EMERGEFM database. Categories include agricultural products, manufactured goods, mineral products, and services. The table includes commodities important to Liberia’s economy such as gold, iron ore, diamonds, rubber, cocoa beans, and timber. Monthly data are sourced from the Central Bank of Liberia and start as early as January 2004.

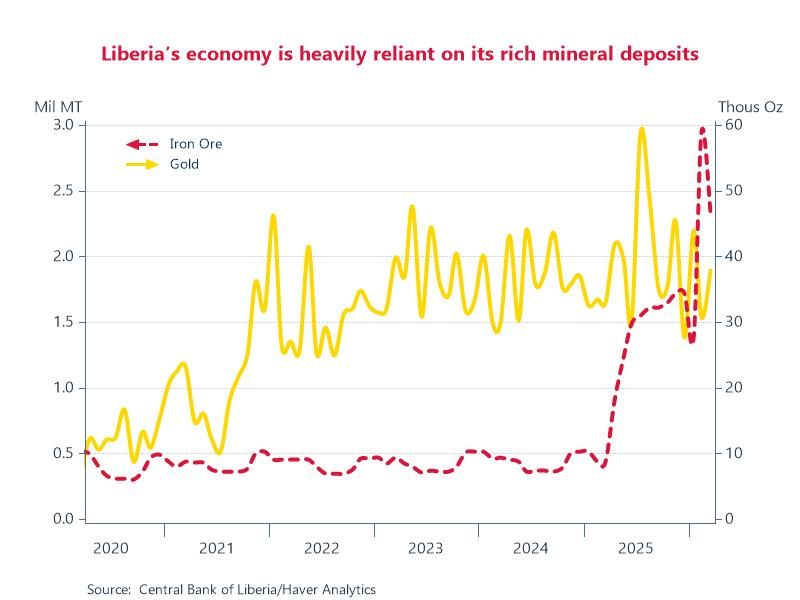
    Chart: Liberia’s economy is heavily reliant on the production and export of primary raw materials. The iron ore sector is the backbone and is experiencing a massive boom with production tripling from 5.2 million MT in 2024 to 14.9 million MT in 2025 – spiking in February 2026 recording 3 million MT in that month alone. Gold production increased 79% YoY in 2021 followed by 49% and 16% increases in the subsequent years – spiking in July 2025 with a record 59 thousand ounces extracted. Expansion in the mining sector is a core catalyst for projected real GDP growth of 5.5%.

  • INSECTOR → Other Nonmetallic Mineral Products → Cement Production

    Cement production data for India were added to the INSECTOR database – Haver’s database for detailed Indian sector statistics. Detail is available for the public and private sectors, mini cement plants, and white Portland cement operations. Monthly data are sourced from the Ministry of Statistics and Programme Implementation and start in June 2023.

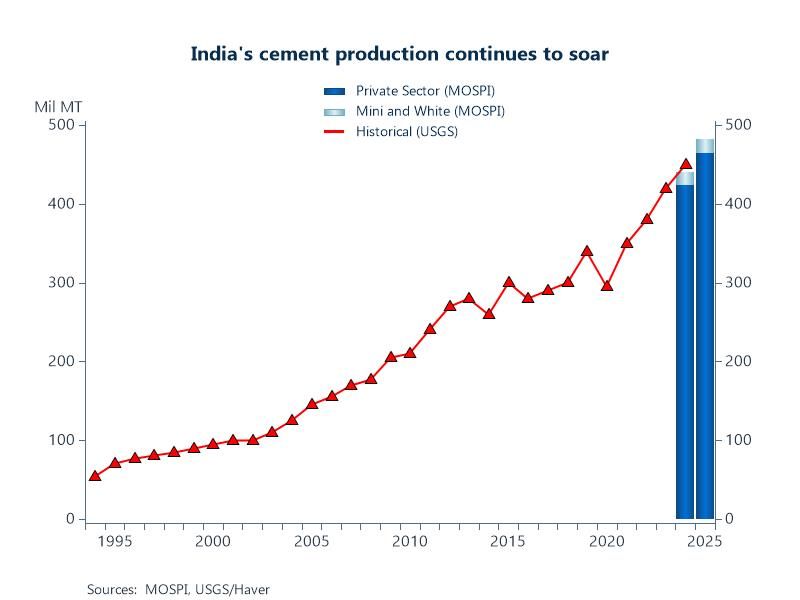
    Chart: India is the second largest cement producer in the world behind China, and accounts for 12.4% of global output. Production has been soaring, recording a 10.5% increase YoY in January and averaging 8% annual growth since 1995. Growth has been driven by surging urbanization, sustained government capital expenditure on mega-infrastructure projects, and the relaxation of government controls (which spurred massive private capacity expansion).

  • EMERGEPRSouth Korea → Financial → Money, Banking and Credit → Substandard or Below Loans

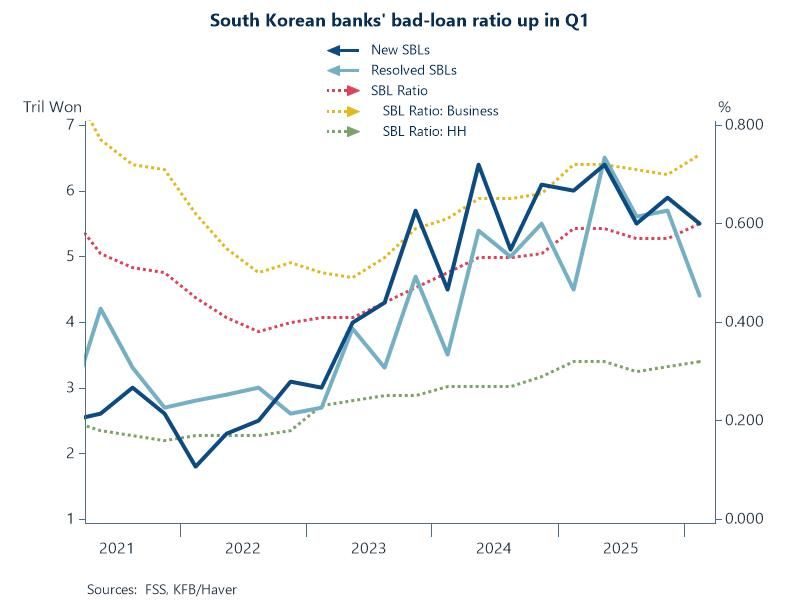
    Substandard or below (SBL) bank loan detail for South Korea was added to the EMERGEPR database. SBL totals, resolved SBL, and SBL ratios by sector are available on this table. Quarterly data are sourced from the Financial Supervisory Service and begin in Q1 2008.

    Chart: SBLs in Korea recorded their highest levels since Q2 2019. Some 5.5 tril won in loans were newly classified as soured in Q1, down 400 bil from Q4. Banks wrote off 4.4 tril worth of bad loans, down 1.3 tril. Business loan SBL ratios registered 0.74%, up 0.04 ppt. HH loan SBL ratio came in at 0.32%, also up 0.01 ppt. Despite an increase in absolute terms, the overall SBL ratio remains relatively stable at 0.6%, safely kept in check by bank write-offs and aggressive settlements.

  • UKRBermuda → National Accounts → GDP by Expenditure

    GDP by expenditure for Bermuda was added to UKR, as we continue to add content for this British Overseas Territory in the North Atlantic. Some detail for consumption, gross capital formation and foreign trade is available in current and constant dollars. Quarterly data are sourced from the Government of Bermuda and start in Q1 2014.

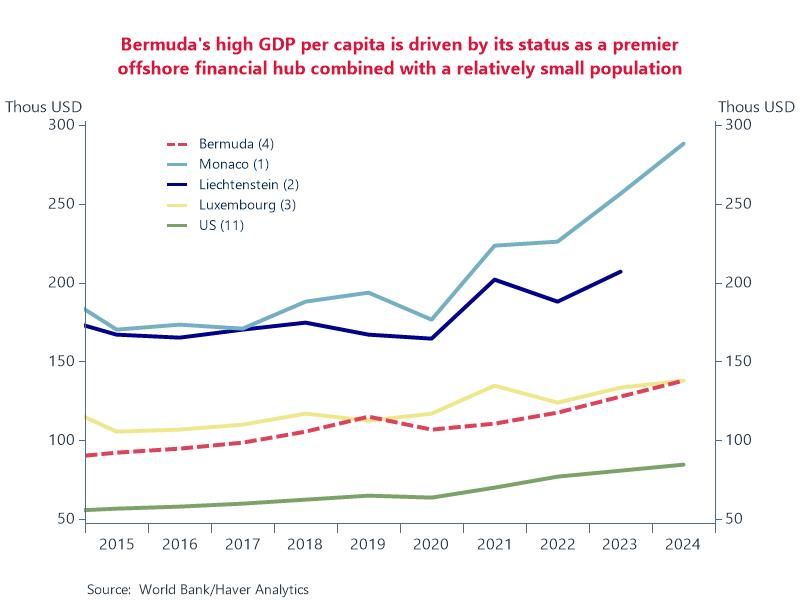
    Chart: Of interest regarding Bermuda’s GDP is its claim to one of the highest GDP per capita metrics in the world – currently registering at over $137k per resident. Only Monaco, Liechtenstein and Luxembourg can boast higher. Bermuda's exceptionally high rank is driven by its status as a premier offshore financial hub - and because it has virtually no corporate or personal income tax, it attracts thousands of international companies that generate enormous economic output on paper combined with a relatively small population of ~64,000.

  • EMERGEPRSouth Korea → Financial → Money, Banking and Credit → Delinquency Rates on Bank Loans

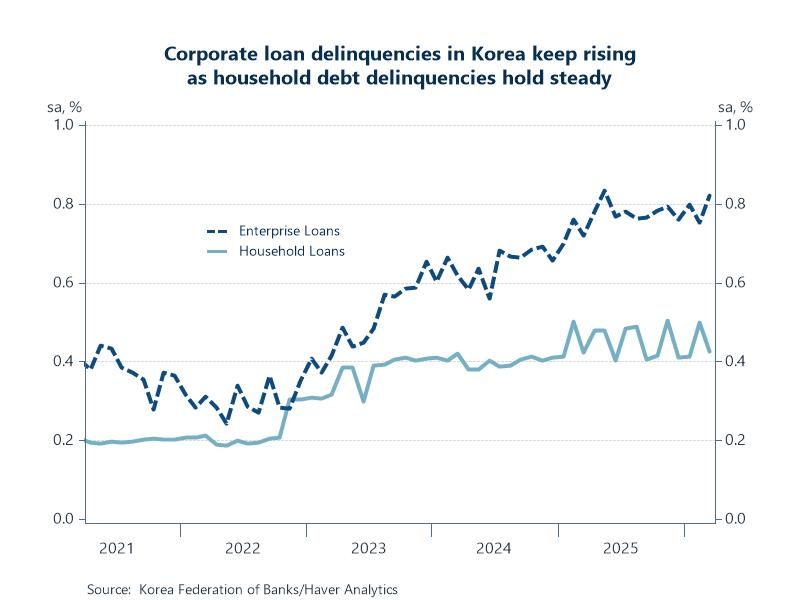
    Delinquency rates on bank loans for South Korea were added to EMERGEPR. More than 1-day and more than 30-day rates for enterprises, households and credit cards are available for commercial and specialized banks. Monthly and annual data are sourced from the Korea Federation of Banks and start as early as 1998.

    Chart: Corporate loan delinquency rates in South Korea are rising faster than household delinquencies. Corporate delinquency rates reached 0.8% at the end of March compared to 0.4% for households – a spread that has been widening since mid-2023. Despite worsening economic conditions, financial authorities have been pressuring banks to expand corporate lending to stimulate business investment. Conversely, strict loan restrictions and debt service ratio rules on household mortgages have been keeping household delinquencies more stable.

  • USECON → Business Cycle Indicators and Surveys → Supply Chain Bottleneck Sentiment

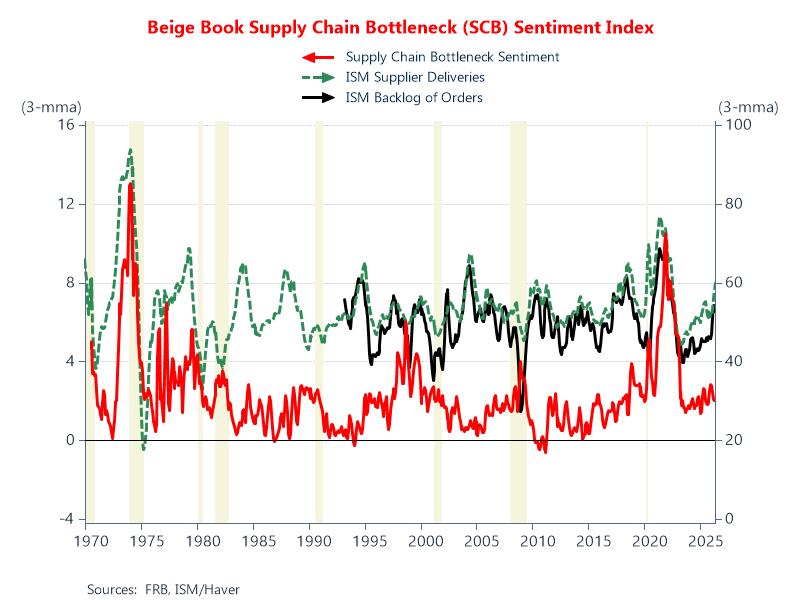
    The Supply Chain Bottleneck (SCB) Sentiment index was added to USECON. This index utilizes unsupervised machine learning and natural language processing techniques to identify words related to supply chain bottlenecks in the Federal Reserve's Beige Book and uses deep learning to account for the sentiment of the identified supply chain text. Monthly data are sourced from the FRB and start in May 1970.

    Chart: Supply chains were stressed after the 1973 OPEC embargo and the 1979 increases in oil prices resulting from the Iranian Revolution. More recently, bottlenecks arose during the COVID-19 pandemic due to global factory slowdowns, shifts in consumer demand and severe labor shortages. The index suggests that the bottlenecks arising from the pandemic started declining in the latter half of 2021. This is in line with other measures of supply chain bottlenecks, such as the ISM supplier delivery times and order backlogs indexes.

  • EMERGELAMexico → International Trade and Balance of Payments → Trade in Goods by Mode of Transportation

    Trade in goods by mode of transportation for Mexico was added to the EMERGELA database. A trade balance, exports and imports are available by mode of transportation such as by air, road, rail and sea. Monthly data are sourced from INEGI and start in January 2007.

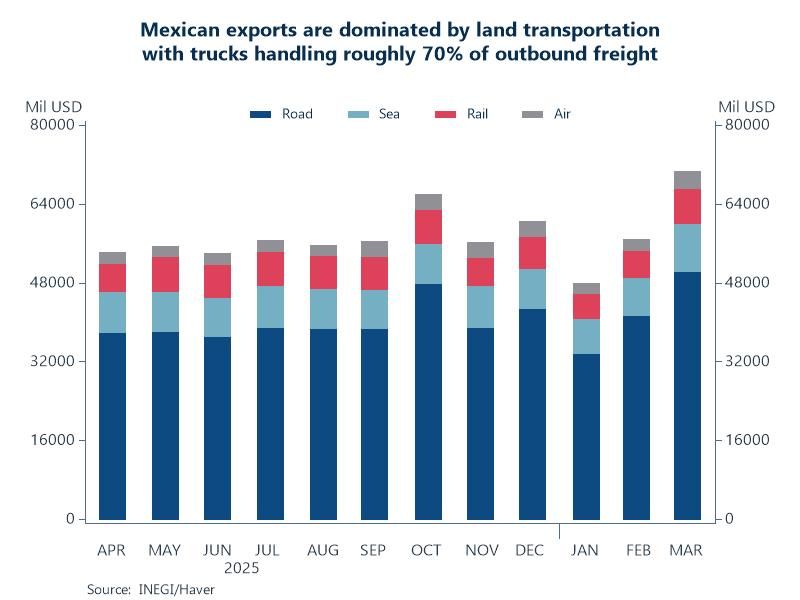
    Chart: Trucks remain the undisputed primary mode for Mexican exports, accounting for up to 70% of exports by value moving across its borders. The surge in just-in-time manufacturing, particularly automotive parts and electronics (like computers and semiconductors), heavily relies on the flexibility, speed, and point-to-point delivery of trucks. Sea freight, which accounts for roughly 15%, is mainly utilized for bulk commodities (such as crude oil and agricultural goods) as well as transcontinental exports.